Unraveling the link between neuropathy target esterase NTE/SWS, lysosomal storage diseases, inflammation, abnormal fatty acid metabolism, and leaky brain barrier
- Institute of Cell Biochemistry, Hannover Medical School, Germany
- Institute of Functional and Applied Anatomy, Research Core Unit Electron Microscopy, Hannover Medical School, Germany
- Institute of Toxicology, Hannover Medical School, Germany
- Mount Desert Island Biological Laboratory, United States
Figures
Figure 1
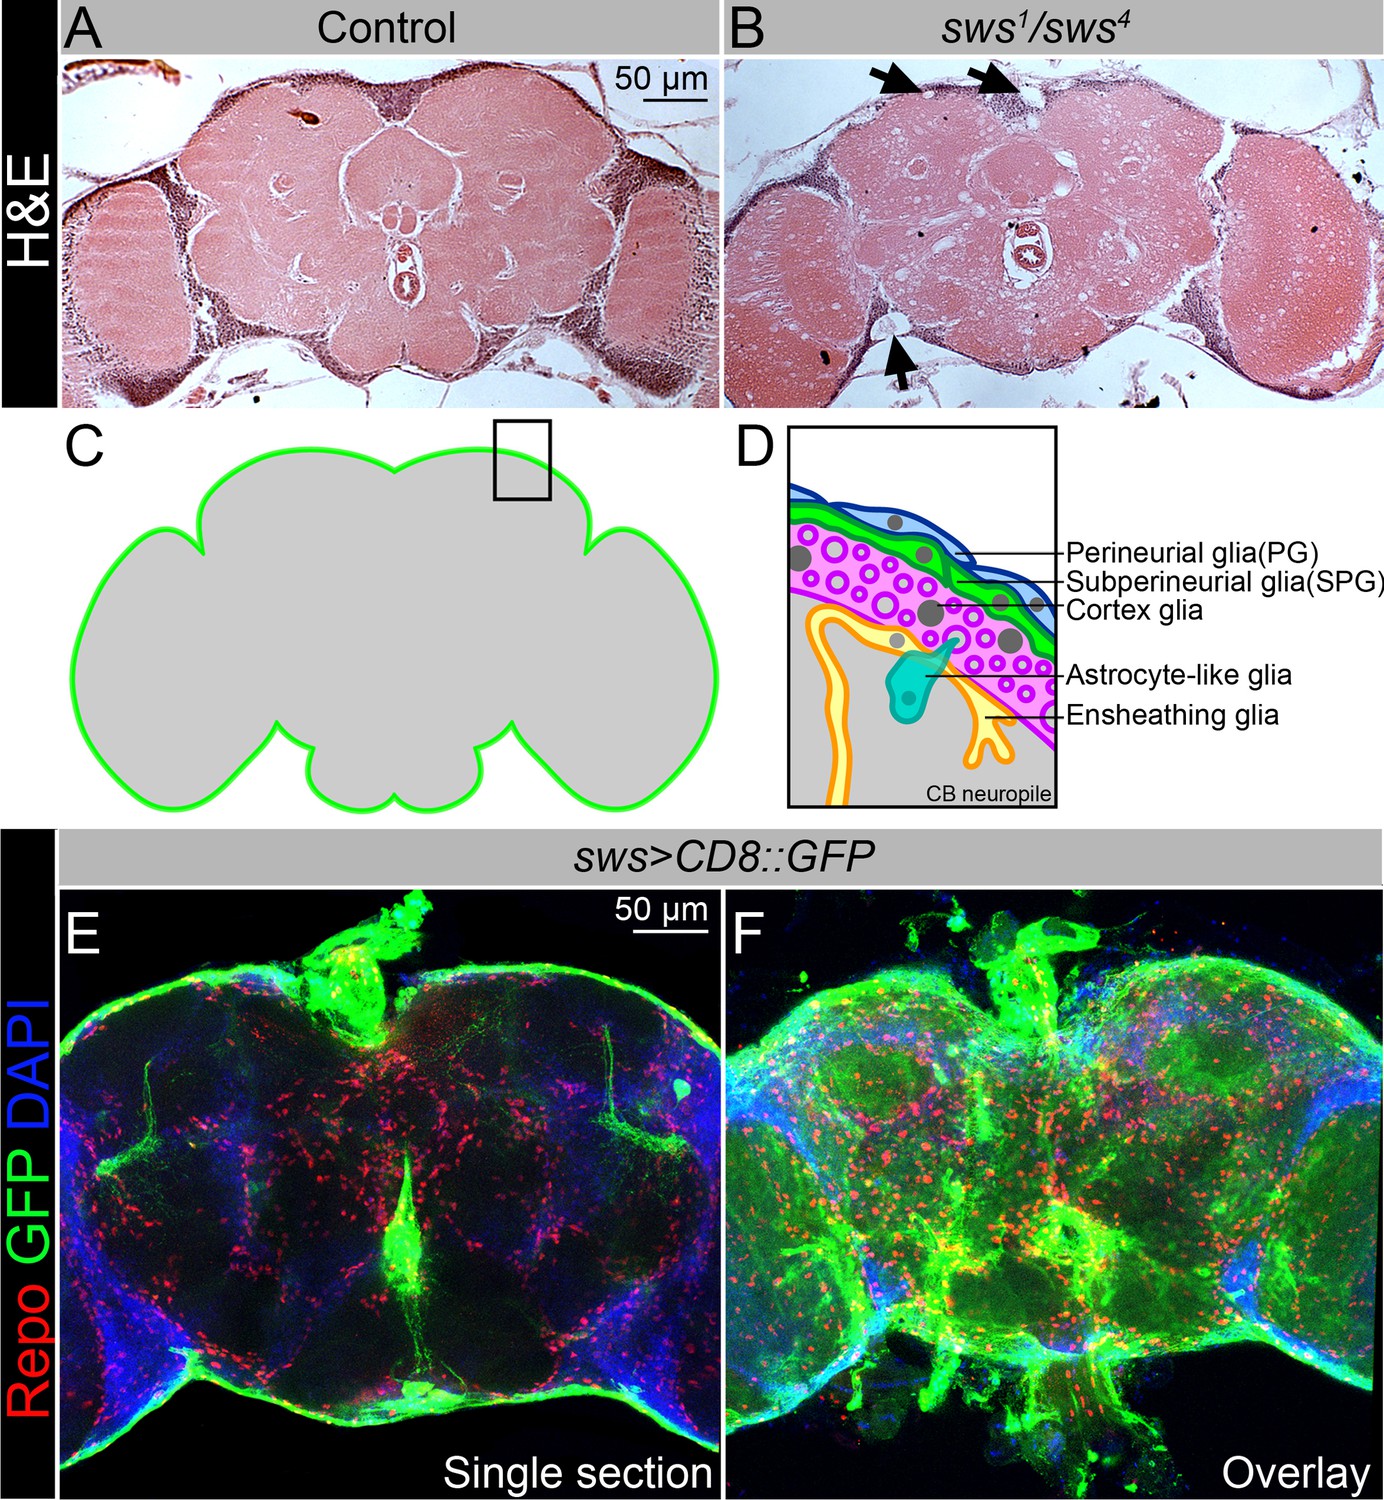
NTE/SWS is expressed in Drosophila brain and its loss leads to severe neurodegeneration.
(A–B) Hematoxylin and eosin (H&E)-stained paraffin-embedded brain sections of the 30-day-old control (OregonR x white1118, A) and 30-day-old sws1/sws4 transheterozygous flies (B). Arrows indicate neurodegeneration at the brain surface. Scale bar: 50 µm. (C–D) Schemes of glia organization in the adult Drosophila brain – perineurial glia (PG, blue), subperineurial glia (SPG, light green), cortex glia (pink), astrocyte-like glia (turquoise), and ensheathing glia (yellow). (E–F) Expression pattern of sws-Gal4 determined by combining of the transcriptional activator Gal4 under control of the sws gene promotor (sws-Gal4) and the UAS-CD8::GFP construct. Fluorescence images of the brain show that sws is expressed in all brain cells and strongly expressed in the surface glia (E – single section, F – Z-stack maximum projection). For NTE/SWS antibody staining pattern, see Figure 2—figure supplement 1A and B. Glia cells are marked with Repo (red), sws expression is marked by the membrane CD8::GFP (green), and nuclei are marked with DAPI (blue). Scale bar: 50 µm.
Figure 2 with 3 supplements

Downregulation of NTE/SWS affects surface glia architecture.
(A–D) Adult brains stained with Coracle (CoraC) (green) and DAPI (magenta). (A) In controls (Oregon R x white1118), CoraC expression is pictured as the smooth line at the surface of the brain (green arrow). In sws1 mutants (B) and in mutants with sws downregulation in subperineurial glia (SPG) cells (moody>swsRNAi, C) the outer glial cell layer labeled by CoraC is irregular and contains either lesions (blue arrow) or lesions and membrane clusters (magenta arrow). Expression of human NTE (sws1; moody>hNTE, D) in SPG cells in mutant background results in the brain surface appearance which is similar to control (green arrow). Scale bar: 50 µm. (E–G) Adult brains stained with CoraC (red), GFP (green), and DAPI (blue) to detect SPG cell membranes marked by co-expression of CoraC and moody>CD8::GFP (red + green = yellow). (E) A smooth line of SPG cell membranes is observed at the surface of control brains (moody>CD8::GFP). (F) In sws loss-of-function mutants (sws1; moody>CD8::GFP), most of the vacuoles formed near the brain surface are filled with the GFP-positive SPG membranes. (G) Downregulation of sws specifically in SPG cells (moody>swsRNAi) results in the appearance of the same excessive SPG cell membranes inside the brain lesions. Scale bar: 50 µm. (H) Bar graph shows the percentage of the brain hemispheres with defective brain surface. The percentage of the brain hemispheres with normal brain surface is shown in green, the percentage of the brain hemispheres containing lesions is shown in blue, and the percentage of the brain hemispheres with formed lesions and membrane clusters within the brain surface is shown in purple. Two-way tables and chi-squared test were used for statistical analysis. *p<0.05, **p<0.005, ***p<0.001, black asterisks – compared to Gal4-driver x OR, red asterisks – compared to Gal4-driver x UAS-swsRNAi, number of adult brain hemispheres ≥43, at least three biological replicates (see Supplementary file 2).
Figure 2—figure supplement 1
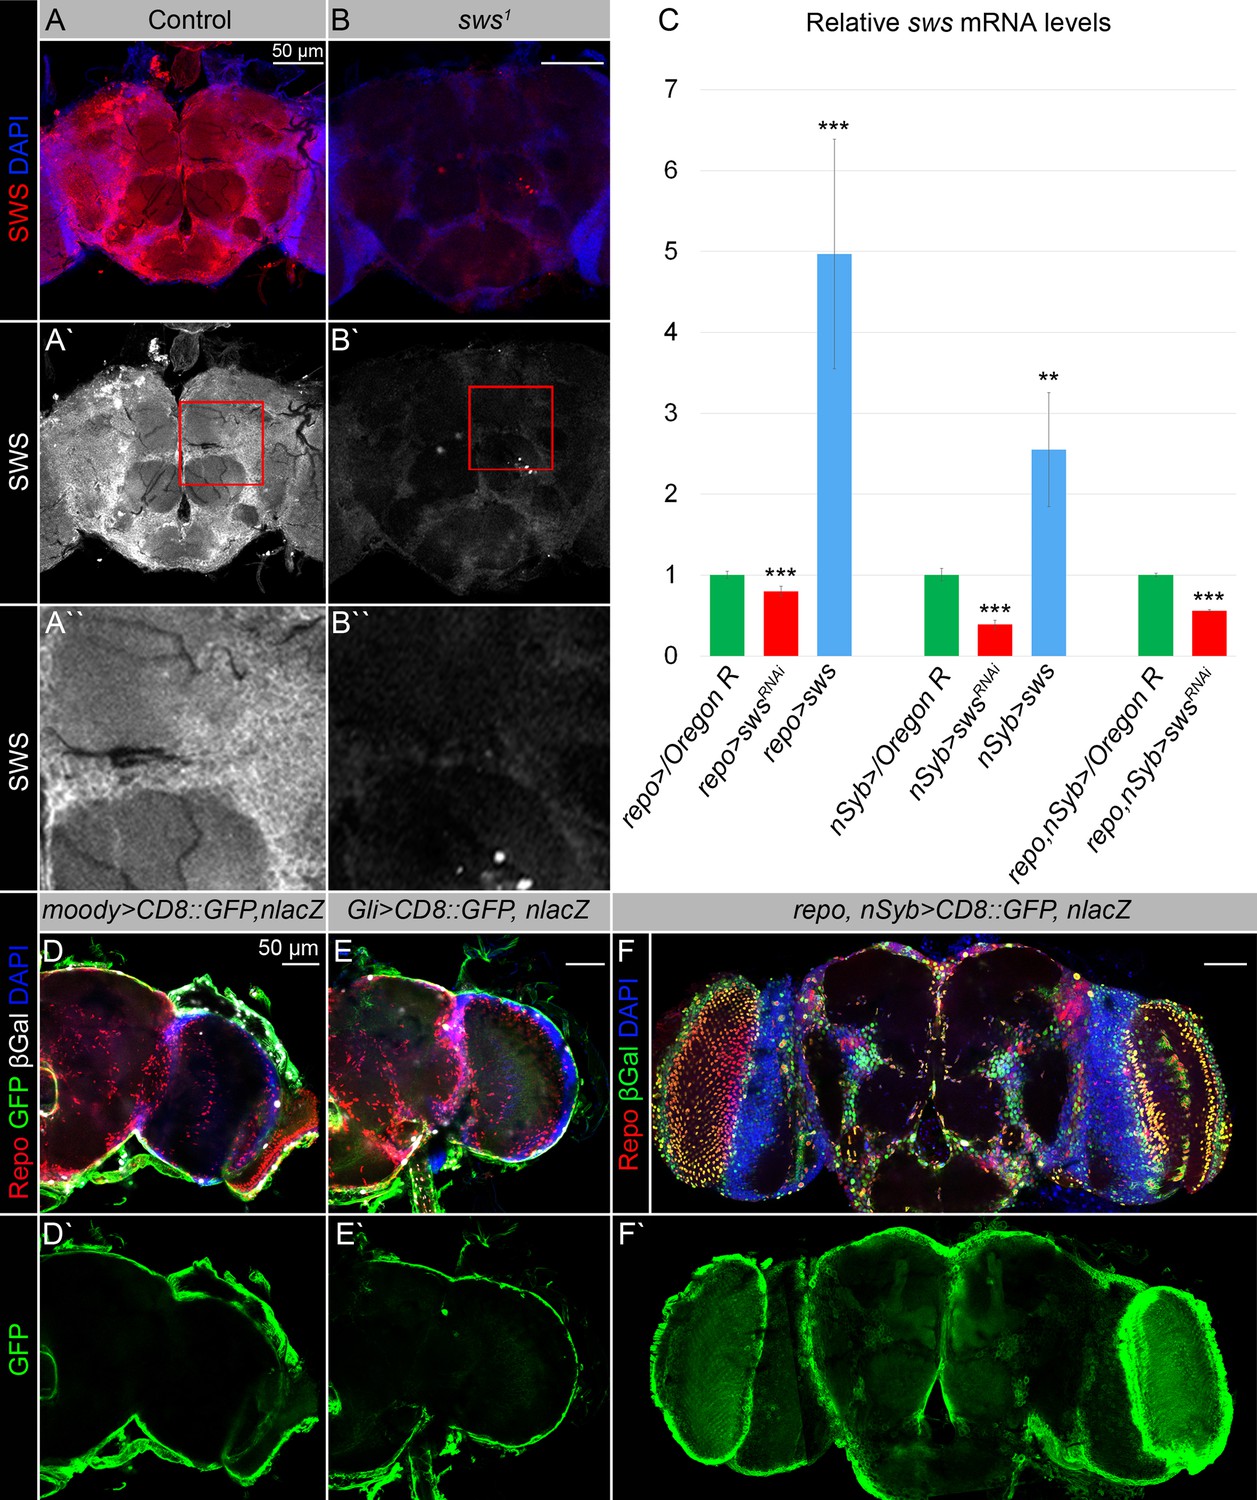
NTE/SWS expression pattern, sws mRNA levels, and expression patterns of the Gal4 driver lines used in the study.
(A–B) Adult brains stained with anti-SWS antibodies (red) and DAPI (blue). (A–Aʹ) Adult brains stained with anti-SWS antibodies (red) and DAPI (blue) show that NTE/SWS is expressed in most if not all brain cells in the control (Oregon R). (B–Bʹ) In sws1 mutant brains, NTE/SWS expression is dramatically reduced. Scale bar: 50 µm. (C) Real-time quantitative PCR (RT-qPCR) analysis of sws mRNA levels from flies with glial, neuronal, or glial and neuronal sws downregulation (repo>swsRNAi, nSyb>swsRNAi, and repo, nSyb>swsRNAi) confirms the efficacy of swsRNAi (red) and UAS-sws (blue) constructs. AVE ± SEM is indicated. Two-tailed Student’s test was used to test for statistical significance, *p<0.05, **p<0.005, ***p<0.001 (see Supplementary file 1). (D–Dʹ) Expression pattern of moody-Gal4 determined by combining of the transcriptional activator Gal4 under control of the moody gene promotor (moody-Gal4) and the UAS-CD8::GFP and UAS-nLacZ constructs. Fluorescence images of the brain show that moody is strongly expressed in the surface glia. Glia cells are marked with Repo (red), moody expression is indicated by the membrane CD8::GFP (green) and nuclear β-Galactosidase (βGal, white), and nuclei are marked with DAPI (blue). Scale bar: 50 µm. (E–Eʹ) Expression pattern of Gli-Gal4 determined by combining of the transcriptional activator Gal4 under control of the Gliotactin gene promotor (Gli-Gal4) and the UAS-CD8::GFP and UAS-nLacZ constructs. Fluorescence images of the brain show that Gliotactin is strongly expressed in the surface glia. Glia cells are marked with Repo (red), Gli expression is indicated by the membrane CD8::GFP (green) and nuclear β-Galactosidase (βGal, white), and nuclei are marked with DAPI (blue). Scale bar: 50 µm. (F–Fʹ) Expression pattern of the double driver line (repo, nSyb-Gal4) determined by combining of the transcriptional activator Gal4 under control of the glial repo and neuronal nSyb promotors (repo, nSyb-Gal4) driving UAS-CD8::GFP and UAS-nLacZ transgenic constructs. Fluorescence images of the brain show that Repo and nSyb are strongly expressed thought the entire brain. Neuronal cell nuclei are marked by the nuclear βGalactosidase expression driven by nSyb-Gal4 (βGal, green), glial cell nuclei are marked by expression of the nuclear β-Galactosidase (βGal, green) driven by repo-Gal4 and anti-Repo antibodies (red) (red + green = yellow) (F). Fluorescence images of the brain show that repo, nSyb-Gal4 is strongly expressed in glia and neurons marked by the membrane CD8::GFP (green) (Fʹ). Scale bar: 50 µm.
Figure 2—figure supplement 2
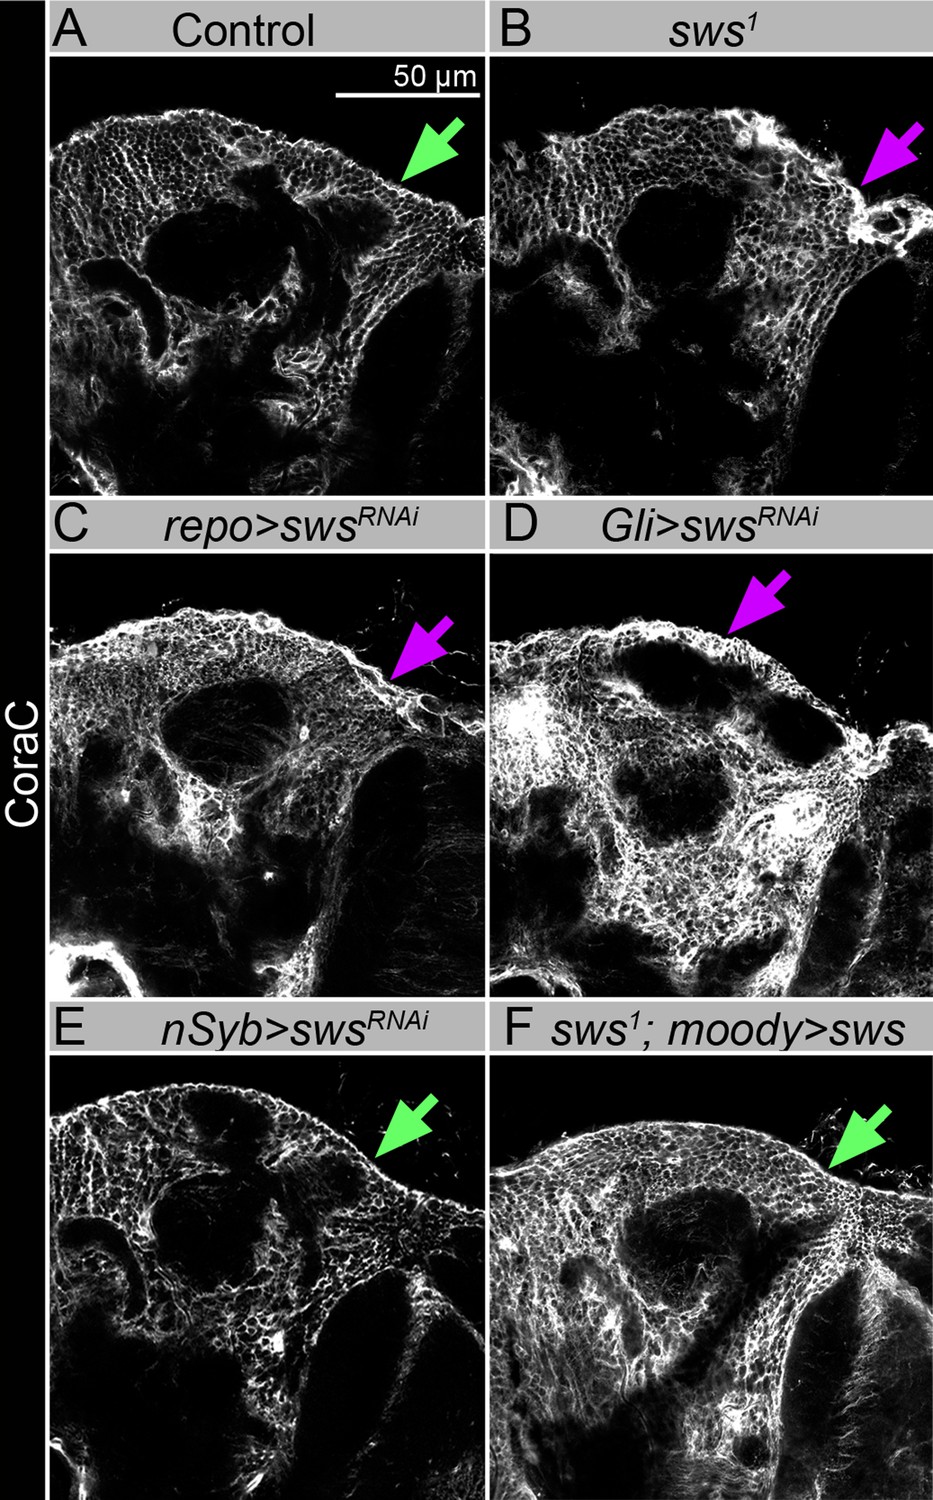
sws downregulation in neurons does not result in the formation of lesions and membrane clusters within the brain surface, and expression of Drosophila NTE/SWS in glia cells rescued glial phenotype.
(A–F) Adult brains stained with Coracle (CoraC) (white). In control (Oregon R x white1118), CoraC expression is pictured as the smooth line at the surface of the brain (green arrow). In sws1 mutants (B) and in mutants with sws downregulation in all glia cells and specifically in subperineurial glia (SPG) cells (repo>swsRNAi and Gli>swsRNAi, C and D , respectively), the outer glial cell layer labeled by CoraC is irregular and contains lesions and membrane clusters (magenta arrows). Animals with sws downregulation in neurons (nSyb>swsRNAi, E) do not have lesions and membrane clusters within the brain surface (green arrow). Expression of Drosophila NTE/SWS (sws1; moody>sws, F) in SPG cells in mutant background results in the brain surface appearance which is similar to control (green arrow). Scale bar: 50 µm.
Figure 2—figure supplement 3
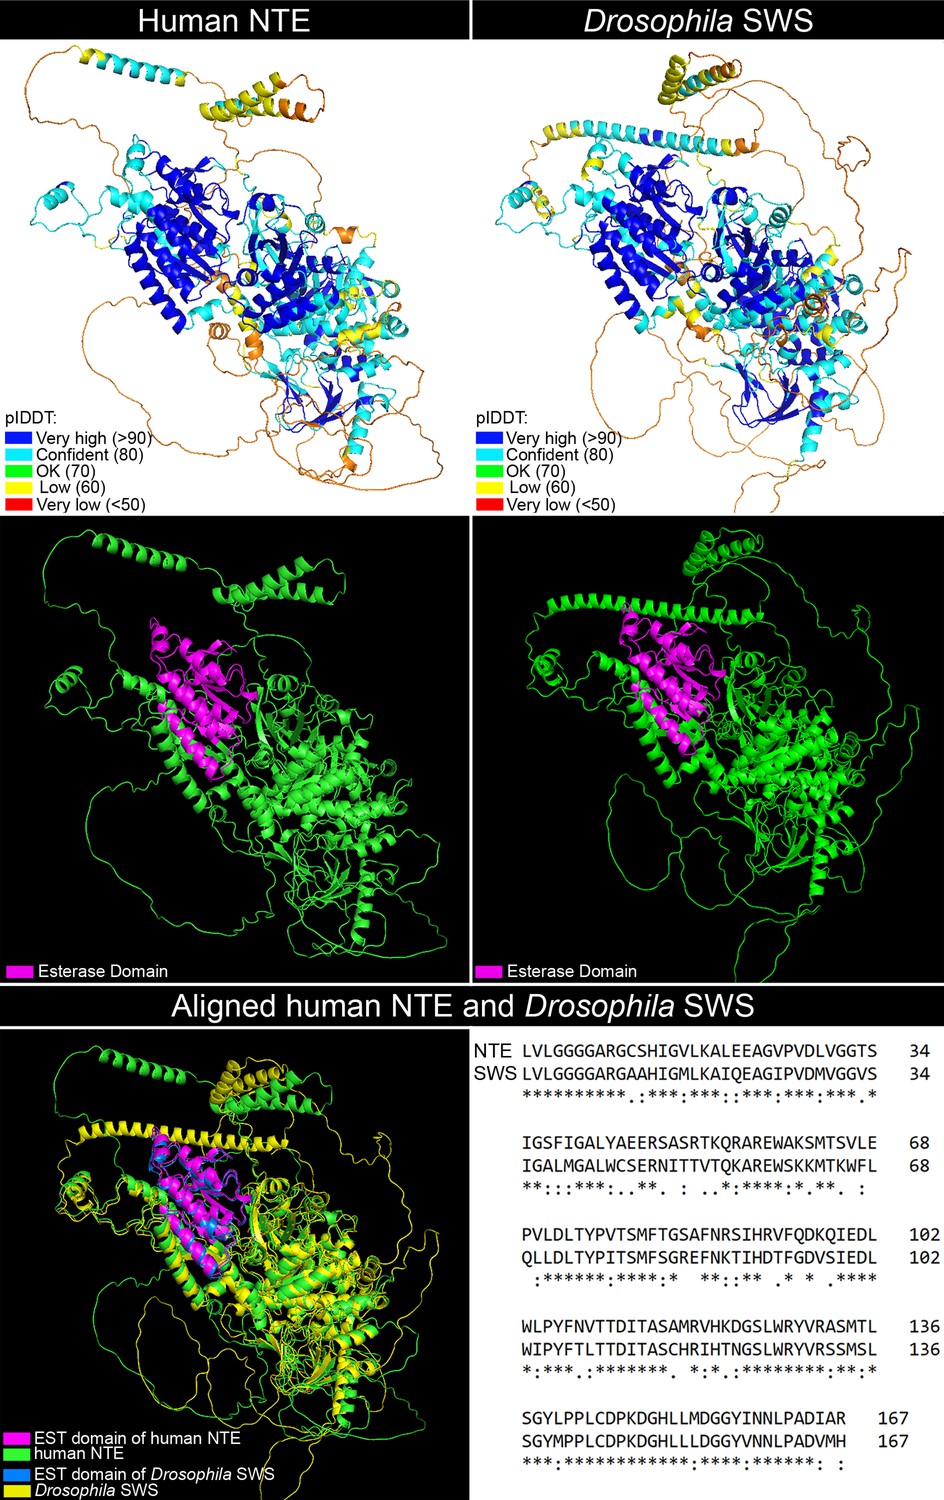
3D structures of human NTE and Drosophila SWS.
The 3D structures of the human NTE and Drosophila NTE/SWS proteins generated using the AlphaFold2 and PyMOL tools. Both proteins contain a highly conserved patatin-like phospholipase domain known as the EST domain. In the NTE/SWS protein, this domain is located between amino acid residues 952 and 1118, while in the NTE protein, it spans residues 981–1147. The EST domain is characterized by a three-layer α/β/α architecture with a central six-stranded β-sheet sandwiched essentially between α-helices front and back. Comparison of the predicted structures of EST-SWS and EST-NTE show that they overlap. The EST domains in both proteins exhibit a high level of confidence as helices, with pLDDT exceeding 90, indicating high accuracy and reliability in their structural predictions.
Figure 3

Downregulation of NTE/SWS results in intracellular accumulations.
(A–C) Electron microscopy images of the surface area of the adult brains. (A) In controls (white1118), glia cells that do not contain any abnormal subcellular structures. Scale bar: 1 µm. (B–Bʹ) sws1 mutant brains have irregular surface and abnormal accumulation of endomembranous structures (yellow arrows) and lipid droplets (red arrows). Scale bar: 5 µm. (C) moody>swsRNAi fly brain has same abnormal accumulations of endomembranous structures (yellow arrows) as sws mutant. Scale bar: 5 µm. (D–Dʹ) Adult brains stained with Rab7 (red) to detect lysosomes and late endosomes, GFP (moody>CD8::GFP, green) to mark subperineurial glia (SPG) cell membranes and DAPI (blue) to mark nuclei. (D) A smooth line of SPG cell membranes is observed at the surface of control brains (moody>CD8::GFP, green), Rab7 is present in relatively small amounts and evenly dispersed throughout in the brain (red). (Dʹ) In sws loss-of-function mutants (sws1; moody>CD8::GFP), Rab7-positive structures colocalized with atypical membrane aggregates of GFP-positive SPG membranes (red + green = yellow). (Dʹ) Downregulation of sws specifically in SPG cells (moody>swsRNAi) results in the appearance of the same assemblies in the SPG cells (yellow). Scale bar: 50 µm. (E–Eʹ) Adult brains stained with CathepsinL (red) to detect lysosomes, GFP (moody>CD8::GFP, green) to mark SPG cell membranes, and DAPI (blue) to mark nuclei. (E) A smooth line of SPG cell membranes is observed at the surface of control brains (moody>CD8::GFP, green), CathepsinL is present in relatively small amounts in the brain (red). (D) In sws loss-of-function mutants (sws1; moody>CD8::GFP), CathepsinL-positive structures colocalized with atypical membrane aggregates of GFP-positive SPG membranes (red + green = yellow). (Eʹ) Downregulation of sws specifically in SPG cells (moody>swsRNAi) results in the appearance of the same assemblies in the SPG cells (yellow). Scale bar: 50 µm. (F) Bar graph shows the percentage of brains with accumulated Rab7 structures at the brain surface. Two-way tables and chi-squared test were used for statistical analysis. *p<0.05, **p<0.005, ***p<0.001, black asterisks – compared to moody-Gal4 x OR, red asterisks – compared to 1-day-old moody-Gal4 x UAS-swsRNAi, number of adult brain hemispheres ≥44, at least three biological replicates (see Supplementary file 3). (G) Bar graph shows the percentage of brains with accumulated CathepsinL structures at the brain surface. Two-way tables and chi-squared test were used for statistical analysis. *p<0.05, **p<0.005, ***p<0.001, black asterisks – compared to moody-Gal4 x OR, red asterisks – compared to 1-day-old moody-Gal4 x UAS-swsRNAi, number of adult brain hemispheres ≥49, at least three biological replicates (see Supplementary file 3).
Figure 4
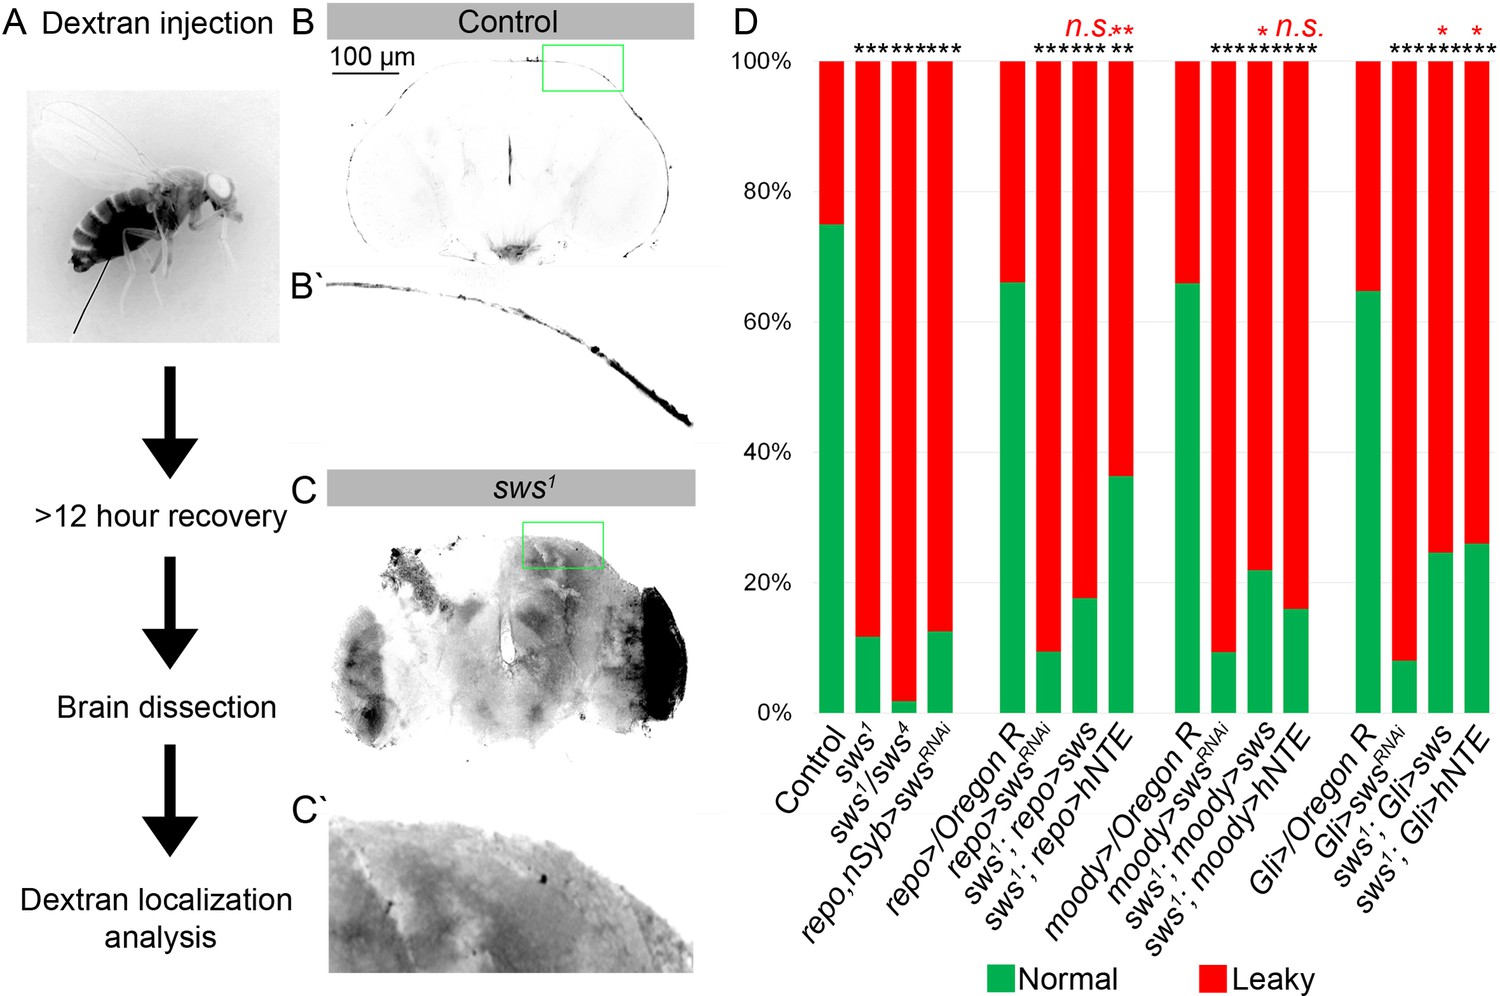
Downregulation of NTE/SWS affects brain permeability barrier.
(A) Scheme of 10 kDa dextran dye permeability assay (see also Materials and methods for a detailed description of the procedure). (B–C) Localization of dextran dye more than 12 hr after injection in control (Oregon R) flies (B–Bʹ) and in sws1 mutant (C–Cʹ). Note that dextran dye can be detected in the cells present inside the mutant brain in contrast to control, where dye stays at the outer surface of the brain. Scale bar: 100 µm. (D) Bar graph shows the percentage of the brains with the defective permeability barrier. Two-way tables and chi-squared test were used for statistical analysis. *p<0.05, **p<0.005, ***p<0.001, black asterisks – compared to Gal4-driver x OR, red asterisks – compared to Gal4-driver x UAS-swsRNAi, number of adult brain hemispheres ≥44, at least three biological replicates (see Supplementary file 4).
Figure 5 with 3 supplements
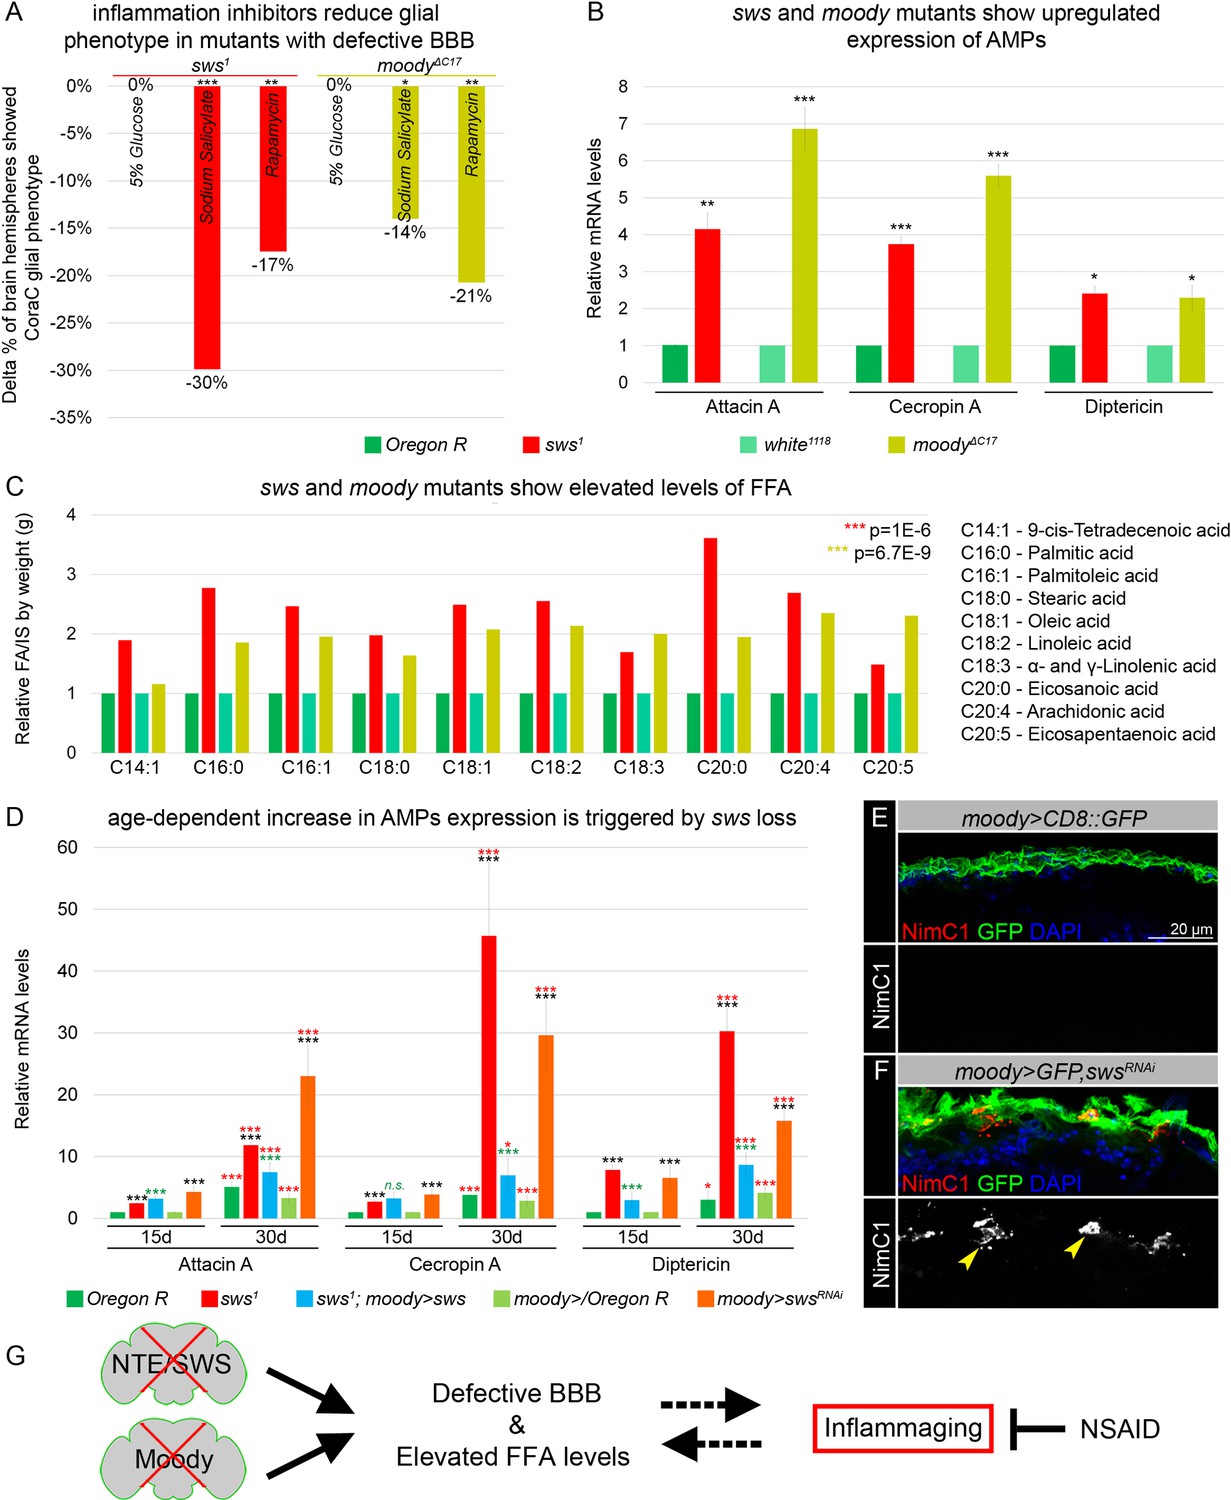
Mutants with defective blood-brain barrier (BBB) have an increased age-dependent inflammatory response and elevated levels of free fatty acid (FFA).
(A) Bar graph shows the reduction in the percentage of the glial phenotype, assayed by Coracle (CoraC) expression pattern, in sws1 (red) and moodyΔC17 (olive) mutants that were treated with non-steroidal anti-inflammatory drug (NSAID) and rapamycin in comparison to untreated mutants.This suggests that inflammation accelerates surface glia phenotype. Two-way tables and chi-squared test were used for statistical analysis, number of adult brain hemispheres ≥104, p<0.05, **p<0.005, ***p<0.001, at least three biological replicates (see Supplementary file 5). (B) Real-time quantitative PCR (RT-qPCR) analysis of antimicrobial peptides (AMPs) mRNA levels from relevant controls (green) and sws1 (red) and moody (olive) mutant fly heads shows significantly upregulated expression of inflammatory response genes: Attacin A, Cecropin A, and Diptericin. AVE ± SEM is indicated. Two-tailed Student’s test was used to test for statistical significance, *p<0.05, **p<0.005, ***p<0.001 (see Supplementary file 1). (C) GS-MS measurements of free fatty acids (FFAs) indicate the relative increase of several FFAs in the heads of sws1 (red) and moodyΔC17 (olive) mutants compared to relevant controls (Oregon R and white1118, green). One-way ANOVA test was used for statistical analysis, *p<0.05, **p<0.005, ***p<0.001 (see Supplementary file 6a). (D) RT-qPCR analysis of AMP mRNA levels from the heads of 15- and 30-day-old relevant controls (green), sws1 (red), and moody>swsRNAi (orange) mutants shows the age-dependent upregulation of the expression of inflammatory response genes (Attacin A, Cecropin A, and Diptericin). Moreover, expression of Drosophila NTE/SWS (sws1; moody>sws, blue) in subperineurial glia (SPG) cells in mutant background normalizes levels of AMPs. The AVE ± SEM is shown. Two-tailed Student’s test was used to test for statistical significance. p<0.05, **p<0.005, ***p<0.001 (see Supplementary file 1). Black asterisks – sws1 compared to Oregon R; moody>swsRNAi compared to moody>/Oregon R of the same age. Green asterisks – rescue, sws1; moody>sws compared to sws1. Red asterisks – aging, 30-day-old compared to 15-day-old flies. (E–F) Adult brains stained with NimC1 (red), GFP (green), and DAPI (blue) to reveal the macrophage entry in the brain. Note that no macrophages marked by NimC1 (red) are detected in the control brain (moody>CD8::GFP, E), while NimC1-positive marcrophages are detected in moody>GFP, swsRNAi brain (yellow arrowheads, F). Scale bar: 20 µm. (G) Mutants with defective brain barrier have upregulated innate immunity factors and exhibit elevated levels of FFAs involved in mediating the inflammatory response. Treatment with anti-inflammatory agents alleviates BBB phenotypes, suggesting that a signaling loop that links the condition of the brain barrier permeability, lipid metabolism, and inflammation.
-
Figure 5—source data 1
GS-MS measurements of free fatty acids (FFA).
- https://cdn.elifesciences.org/articles/98020/elife-98020-fig5-data1-v2.xls
Figure 5—figure supplement 1
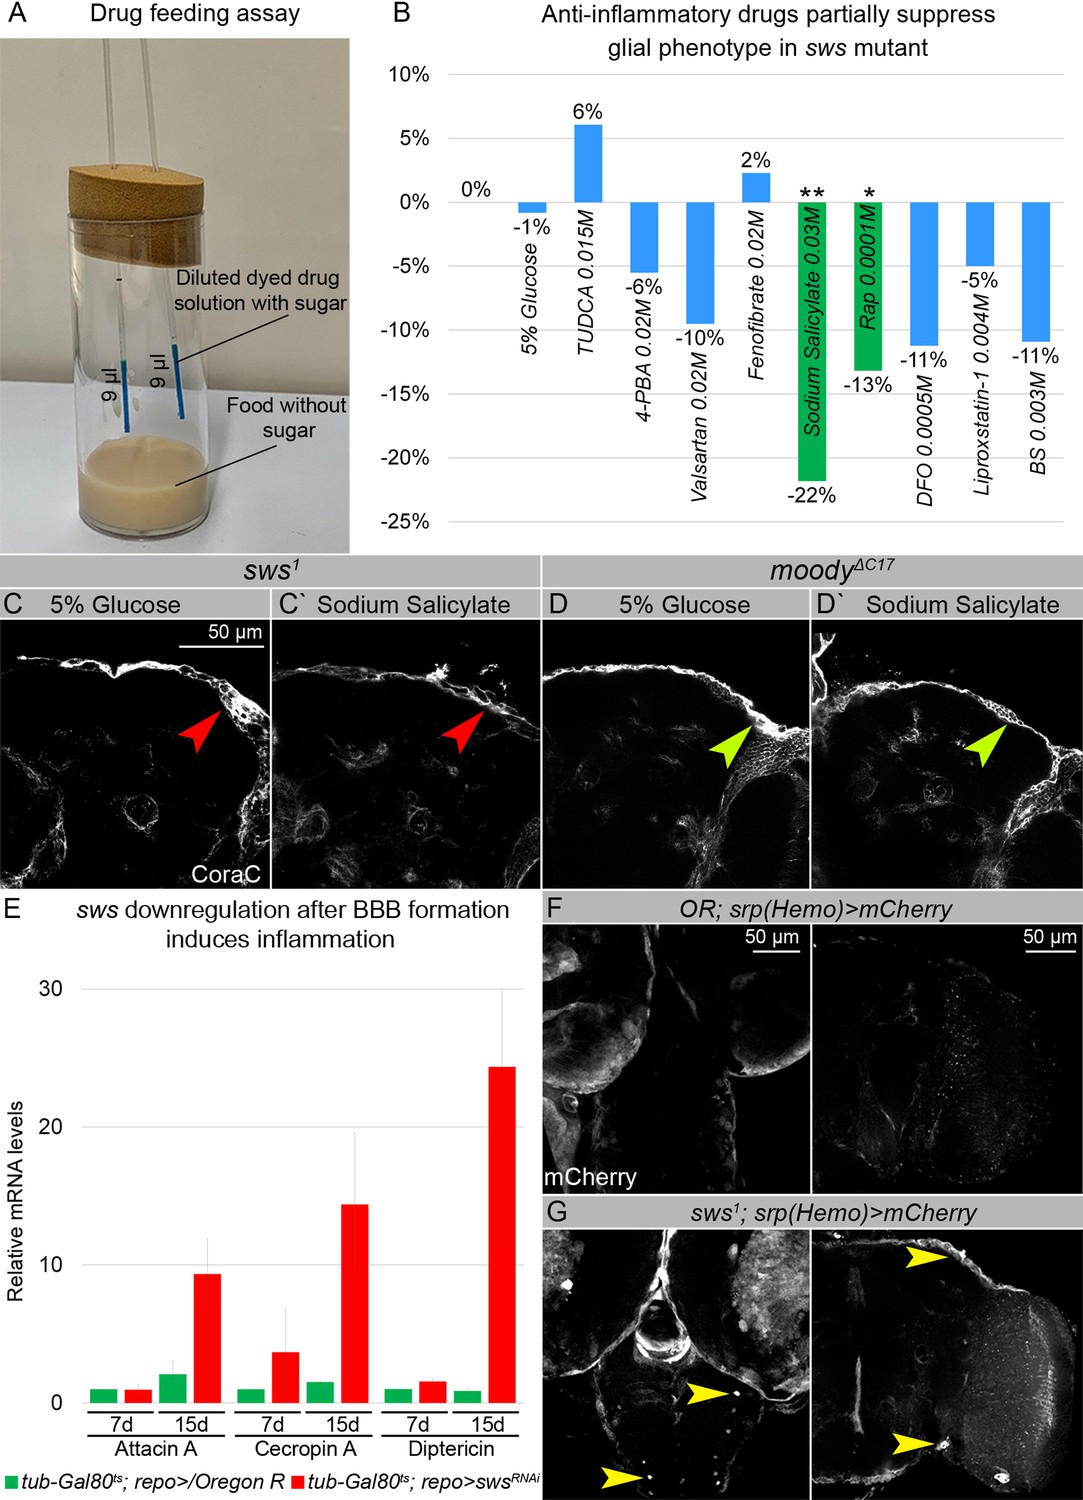
sws mutants show increased inflammation and macrophage entry into the brains.
(A–B) Anti-inflammatory drugs partially suppress glial phenotypes in sws mutants. (A) For the drug feeding assay, vials with sugar-free food with two micropipettes filled with dyed drug solution were used. (B) Bar graph shows the changed percentage of the brains of sws mutants with the glial phenotype, assayed with Coracle (CoraC), which were treated with different stress and inflammation inhibitors in comparison to untreated mutants. Two-way tables and chi-squared test were used for statistical analysis. *p<0.05, **p<0.005, ***p<0.001, number of adult brain hemispheres ≥73, at least three biological replicates (see Supplementary file 5). (C–Cʹ) Adult brains of sws mutants stained with CoraC (white). In sws1 mutants treated with control solution (C), the outer glial cell layer labeled by CoraC is irregular and contains membrane clusters (red arrowhead). In sws1 mutants treated with sodium salicylate (Cʹ) the outer glial cell layer contains lesions (red arrowhead) and less membrane clusters. Scale bar: 50 µm. (D–Dʹ) Adult brains of moody mutants stained with CoraC (white). In moody mutants treated with control solution (D), the outer glial cell layer labeled by CoraC is irregular and contains membrane clusters (olive arrowhead). In moody mutants treated with sodium salicylate (Dʹ), the outer glial cell layer contains lesions (olive arrowhead) and no membrane clusters. (E) sws downregulation in glial cells during adulthood, after the BBB is formed, leads to the increased inflammatory response. Real-time quantitative PCR (RT-qPCR) analysis of antimicrobial peptides (AMPs) mRNA levels from control (tub-Gal80ts; repo>/Oregon R, green) and tub-Gal80ts; repo>swsRNAi (red) fly heads shows upregulated expression of inflammatory response genes: Attacin A, Cecropin A, and Diptericin. AVE ± SEM is indicated (see Supplementary file 1). (F–G) Larval and adult brains stained with mCherry (white) to reveal the macrophage entry in the brain, indicating that control (Oregon R/srp(Hemo)3xmCherry) brains. (F) show almost no macrophages marked by mCherry inside the developing and adult brains. Larval and adult brains of sws1; srp(Hemo)3xmCherrymutants (G) show macrophages inside the larval and adult brains (yellow arrowheads). Scale bar: 50 µm.
Figure 5—figure supplement 2
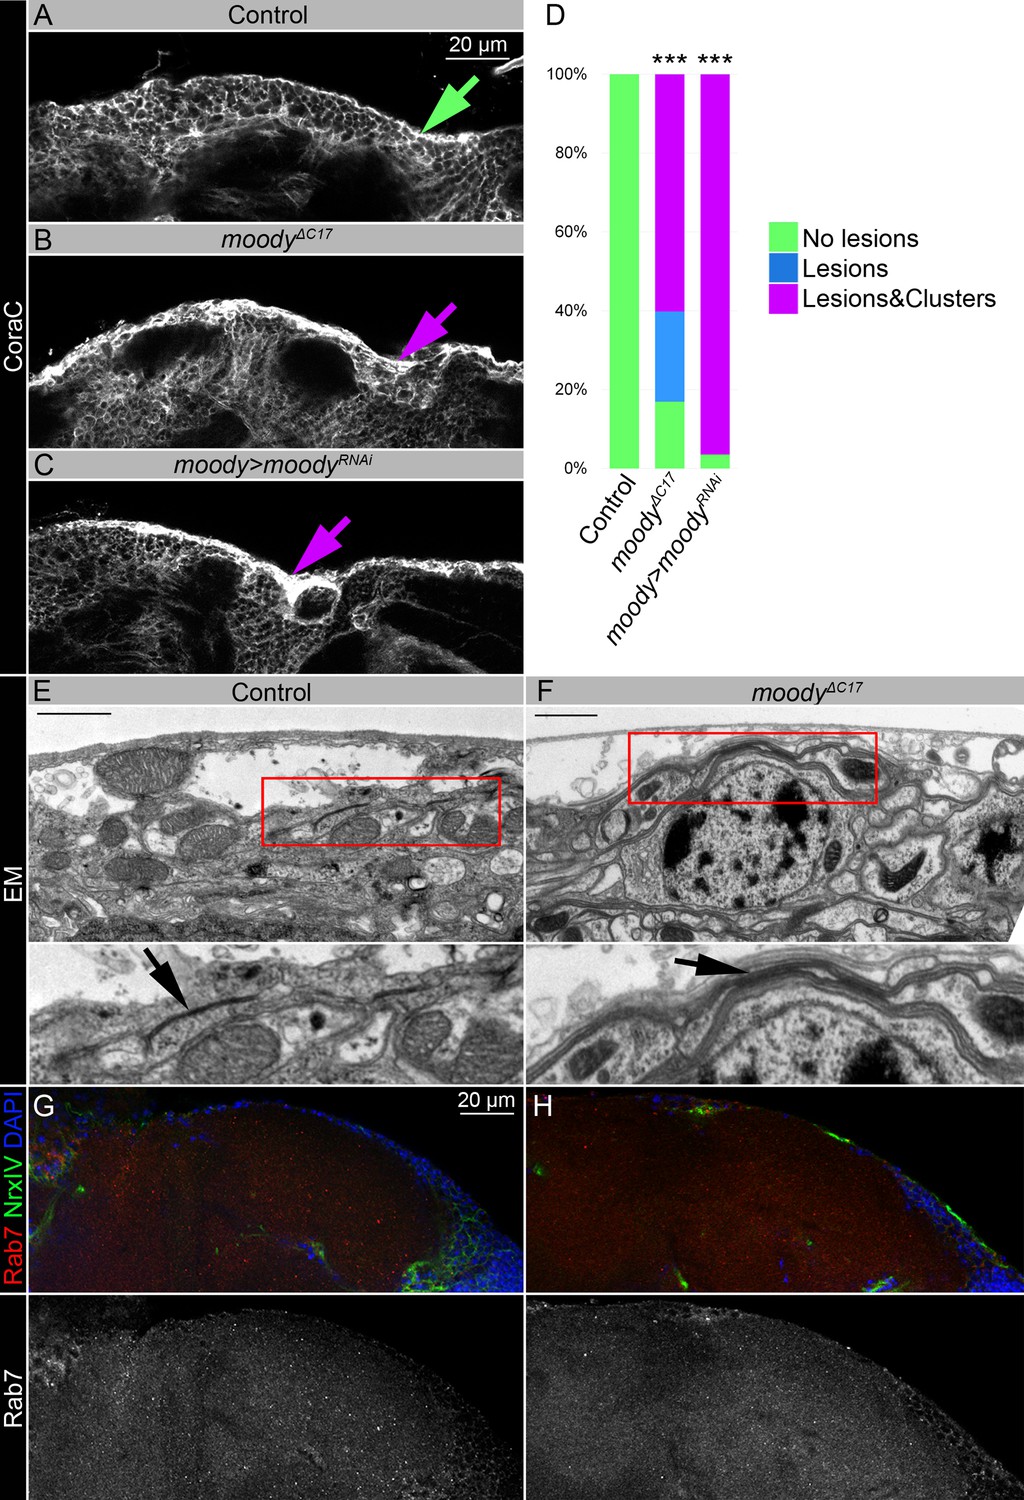
Moody flies with a permeable blood-brain barrier (BBB) have similar to sws mutants brain surface appearance, but distinct septate junction phenotypes, and moodyΔC17 mutant shows no accumulation of endosomal-lysosomal pathway components such as Rab7.
(A–C) Adult brains stained with Coracle (CoraC) (white) to reveal brain surface. CoraC expression in control brains (Oregon R x white1118, A) is depicted as the smooth line at the surface of the brain (green arrow). In moodyΔC17 mutant brains (B) and upon moody downregulation in subperineurial glia (SPG) cells (moody>moodyRNAi, C), CoraC-positive outer cell layer contains lesions and membrane clusters (magenta arrows). Scale bar: 20 µm. (D) Bar graph shows the percentage of the brains with a defective brain surface. Two-way tables and chi-squared test were used for statistical analysis, ***p<0.001, number of adult brain hemispheres ≥20 (see Supplementary file 2). (E–F) Electron microscopy images of the adult brain surface area in control (white1118, E) and moodyΔC17 mutants (F). As previously described (Babatz et al., 2018), the septate junctions in moodyΔC17 mutants cannot properly stretch out during cell growth and appear abnormal when compared to controls (black arrows). Scale bar: 1 µm. (G–H) Adult brains stained with Rab7 (red), Neurexin IV (NrxIV) (green), and DAPI (blue) show no abnormal accumulation of Rab7 vesicles in the Oregon R control (G) and moodyΔC17 mutant (H) brains.
Figure 5—figure supplement 3
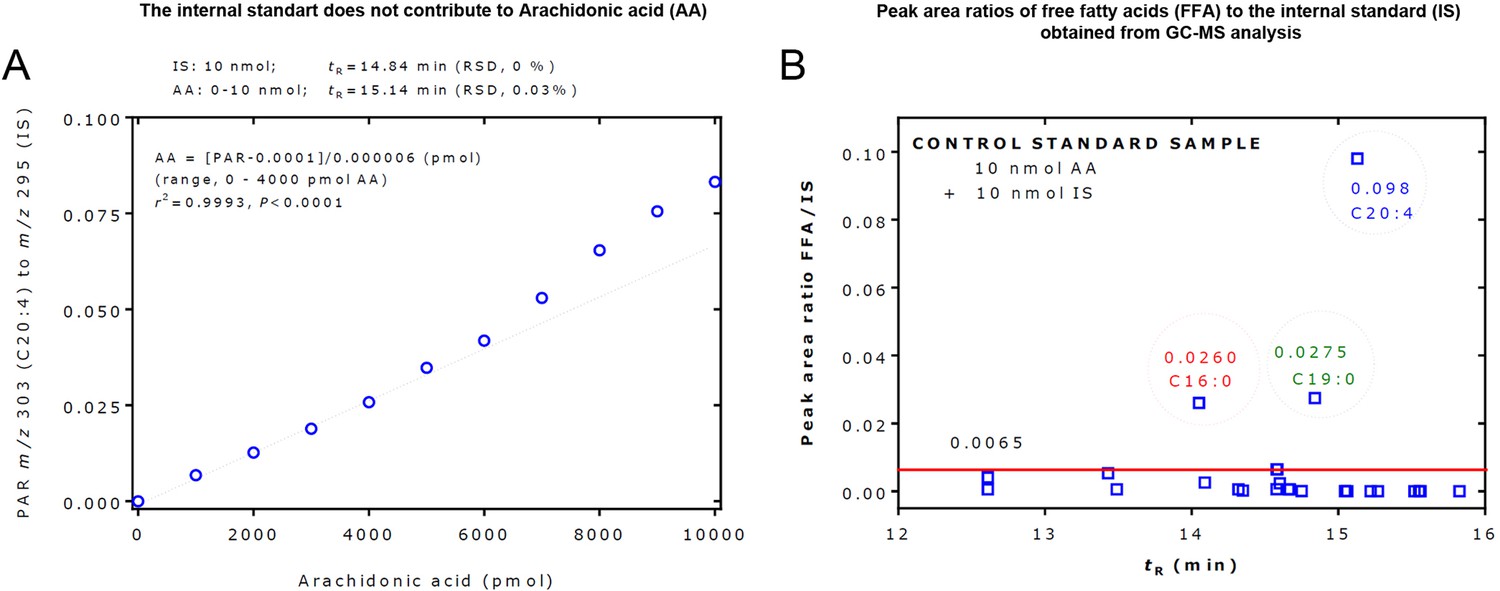
Gas chromatography-mass spectrometry (GC-MS) analysis of free fatty acids (FFAs).
(A) GC-MS measurement of arachidonic acid (C20:4) with the internal standard (IS). The peak area ratio (PAR) of m/z 303 for 20:4 to m/z 295 for the IS was linear in the range 0–4000 pmol of C20:4 at the fixed amount of 10,000 pmol of the IS. The graph shows an example for the quantitative measurement of arachidonic acid (C20:4) with the IS. The peak area ratio of m/z 303 for 20:4 to m/z 295 for the IS was linear in the range 0–4000 pmol C20:4 at the fixed amount of 10,000 pmol of the IS. C20:4 and IS were baseline-separated by chromatography (14.84 min; RSD, 0% vs 15.14 min; RSD, 0.03%) and entirely by mass spectrometry (m/z 295 vs m/z 303). The IS was found not to contribute to C20:4 by contaminating arachidonic acids or by its 13C isotope. On a molar basis, C20:4 produced about 10 times lower peak areas than the IS in a relevant concentration range of arachidonic acid. (B) Peak area ratios of FFAs to the IS obtained from GC-MS analysis of a control standard samples that contained 10 nmol arachidonic acid (C20:4) and 10 nmol of the IS. This figure was constructed with the data of Supplementary file 6c. Each symbol represents an FFA. The horizontal red line at an FFA/IS value of 0.0065 suggests that FFA/IS values higher than 0.0065 can be considered to present in the control standard sample and/or as laboratory contaminations. For more details, see the text. tR, retention time.
Figure 6 with 1 supplement

Septate junction and membrane domain organization in mutants with defective brain permeability barrier.
(A–C) Adult brains stained with a septate junction marker Neurexin IV (NrxIV) (white). Scale bar: 50 µm. (A) In control (Oregon R) brain, septate junctions formed by subperineurial glia (SPG) glia are depicted as condensed and distinct strand. The scheme depicts the intact blood-brain barrier (BBB) formed by perineurial glia (PG) and SPG. The SPG cells establish well-formed septate junctions (SJs) and exhibit organized membrane domains. Furthermore, the lysosomes are fully functional. (B) In moodyΔC17 mutants, due to SPG membrane overgrowth, septate junctions are frayed. The scheme illustrates a defective BBB where the proper extension of septate junction strands during cell growth is impaired, resulting in increased permeability. However, despite this issue, the membrane domains remain well formed, and the lysosomes within the barrier continue to function effectively. (C) In sws1 mutants, septate junctions and membrane domains are not properly organized. By analyzing SPG membranes in sws mutants, abnormal clustering of SJ proteins and disorganized membrane domains are observed. Furthermore, sws-deficient brains exhibit excessive storage of cellular material within lysosomes. The scheme shows that NTE/SWS-related lipid dysregulation is accompanied by dysfunctional lysosomes, impaired distribution of cell junction proteins, and disrupted organization of membrane domains in surface glia. (D–F) Electron microscopy images of the septate junction area at the surface of the control (white1118, D) and sws1 mutant (E–F) adult brains. Green arrowheads indicate septate junctions in control and yellow arrowheads indicate septate junctions in sws1 mutant brains. Scale bar: 250 nm.
Figure 6—figure supplement 1
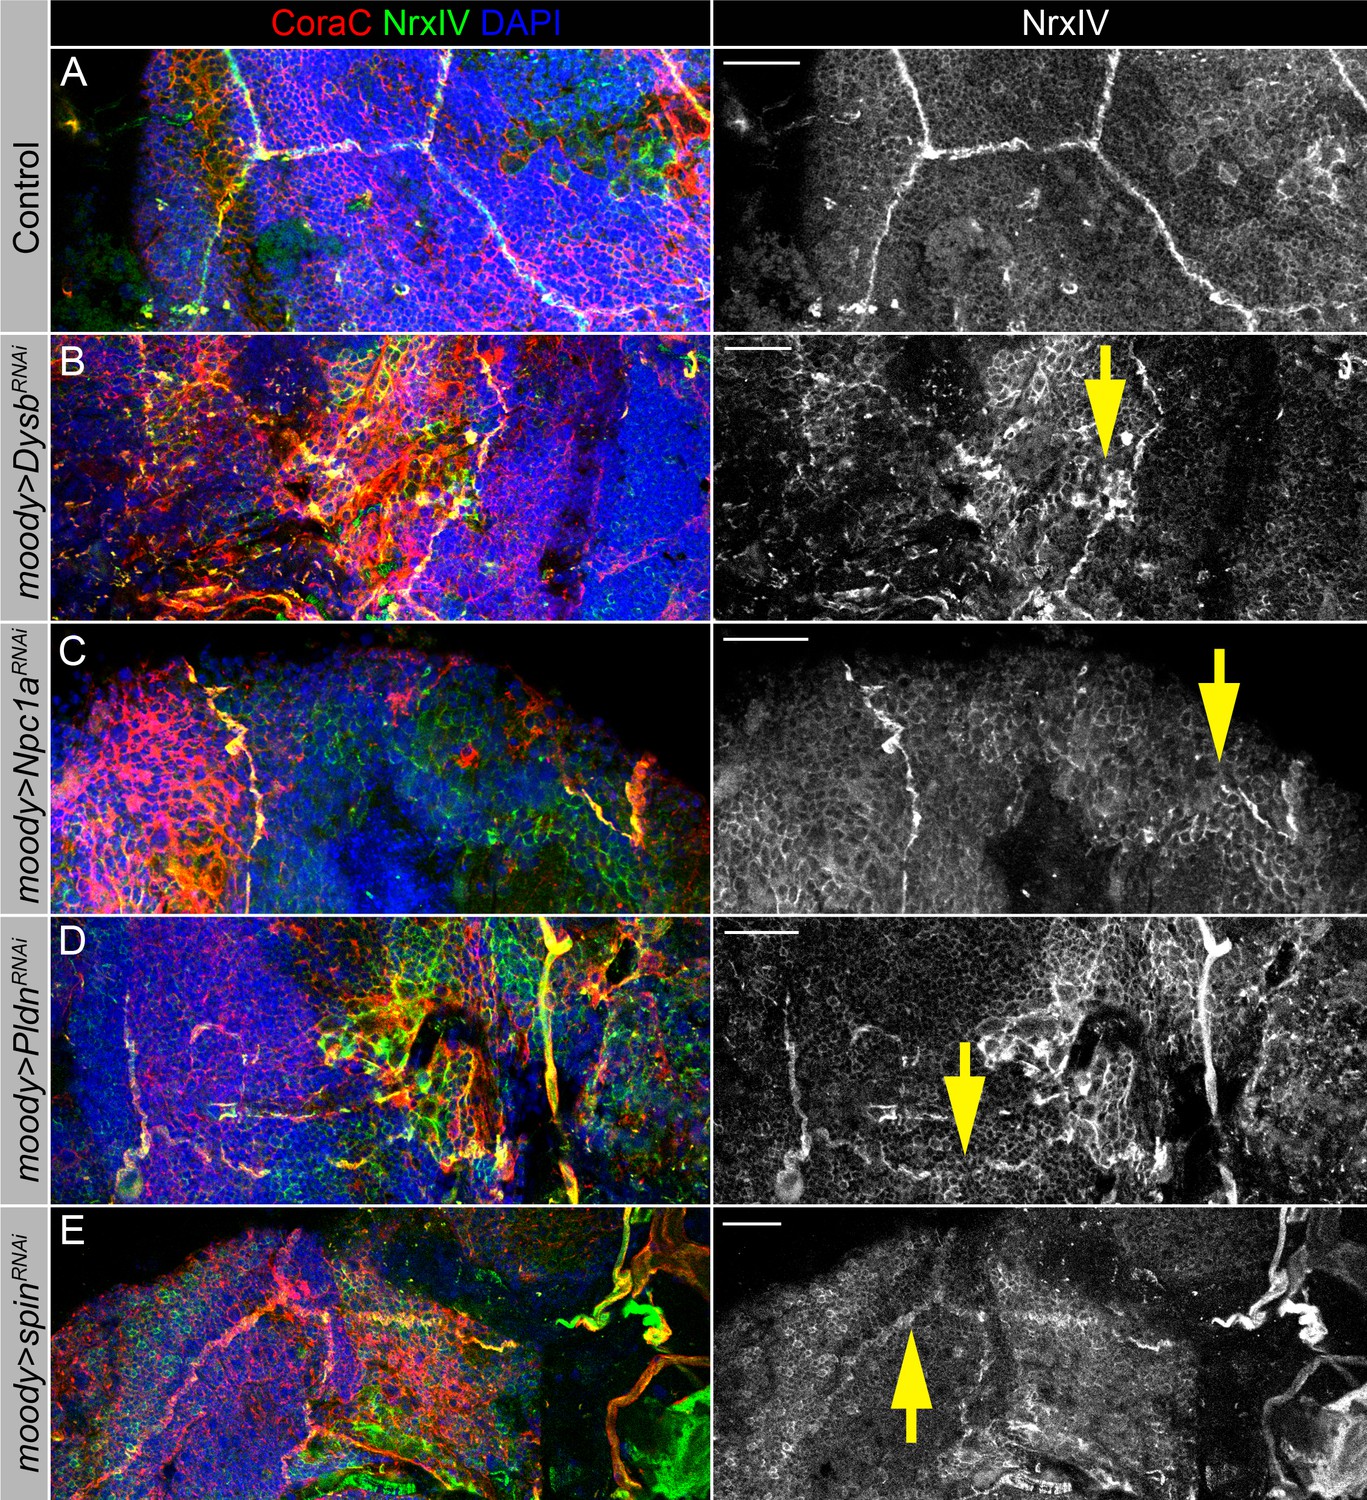
Lysosomal mutants show abnormal septate junction formation.
(A–E) Adult brains stained with Coracle (CoraC) (red), Neurexin IV (NrxIV) (green), and DAPI (blue) to reveal septate junction structures of the surface glia. In control (moody>/Oregon R, A) brain, septate junctions formed by subperineurial glia (SPG) glia are depicted as condensed and distinct strands. In the lysosomal pathway mutants – moody>DysbRNAi (B), moody>Npc1aRNAi (C), moody>PldnRNAi (D), and moody>spinRNAi(E) flies, septate junctions are not properly organized (yellow arrows). Scale bar: 20 µm.
Tables
Appendix 1—key resources table
| Reagent type (species) or resource | Designation | Source or reference | Identifiers | Additional information |
|---|---|---|---|---|
| Antibody | Anti-Repo (mouse monoclonal) | Developmental Studies Hybridoma Bank | #8D12 | IF(1:50) |
| Antibody | Anti-CoraC (mouse monoclonal) | Developmental Studies Hybridoma Bank | #C566.9 | IF(1:50) |
| Antibody | Anti-Rab7 (mouse monoclonal) | Developmental Studies Hybridoma Bank | #AB2722471 | IF(1:50) |
| Antibody | Anti-DE-Cad (rat monoclonal) | Developmental Studies Hybridoma Bank | #DCAD2 | IF(1:50) |
| Antibody | Anti-GFP (chicken polyclonal) | Abcam | #ab13970 | IF(1:1000) |
| Antibody | Anti-mCherry (rabbit polyclonal) | Abcam | #ab167453 | IF(1:1000) |
| Antibody | Anti-β-Galactosidase (mouse monoclonal) | Promega | #Z3781 | IF(1:200) |
| Antibody | Anti-CathepsinL (mouse) | R&D Systems | #1515-CY-010 | IF(1:400) |
| Antibody | Anti-NrxIV (rabbit polyclonal) | Gift from Christian Klämbt | Anti-NrxIV | IF(1:1000) |
| Antibody | Anti-SWS (rabbit polyclonal) | Gift from Doris Kretzschmar | Anti-SWS | IF(1:1000) |
| Antibody | Anti-NimC1 (mouse) | Gift from István Andó | Anti-NimC1 | IF(1:300) |
| Antibody | Anti-chicken Alexa 488 (goat polyclonal) | Thermo Fisher Scientific | #A-11039 | Secondary antibody IF(1:500) |
| Antibody | Anti-rat Alexa 488 (goat polyclonal) | Thermo Fisher Scientific | #A-11077 | Secondary antibody IF(1:500) |
| Antibody | Anti-rat Alexa 647 (goat polyclonal) | Thermo Fisher Scientific | #A-21247 | Secondary antibody IF(1:500) |
| Antibody | Anti-rabbit Alexa 488 (goat polyclonal) | Thermo Fisher Scientific | #A-11034 | Secondary antibody IF(1:500) |
| Antibody | Anti-rabbit Alexa 568 (goat polyclonal) | Thermo Fisher Scientific | #A-11011 | Secondary antibody IF(1:500) |
| Antibody | Anti-mouse IgG2a Cy3 (goat polyclonal) | Jackson ImmunoResearch | #115-165-206 | Secondary antibody IF(1:400) |
| Antibody | Anti-mouse IG1 Cy3 (goat polyclonal) | Jackson ImmunoResearch | #115-165-205 | Secondary antibody IF(1:500) |
| Antibody | Anti-mouse IgG1 647 (goat polyclonal) | Jackson ImmunoResearch | #115-605-205 | Secondary antibody IF(1:500) |
| Genetic reagent (D. melanogaster) | w[1118] | Bloomington Drosophila Stock Center | BDSC 5905 | Wild type strain |
| Genetic reagent (D. melanogaster) | Oregon-R | Bloomington Drosophila Stock Center | BDSC 5 | Wild type strain |
| Genetic reagent (D. melanogaster) | sws1 | Gift from Doris Kretzschmar | sws1 | sws[1]/FM7a(null mutant) |
| Genetic reagent (D. melanogaster) | sws4 | Bloomington Drosophila Stock Center | BDSC 28121 | sws[4]/C(1)DX, y[1] w[1] f[1] (Amino acid replacement: G956D) |
| Genetic reagent (D. melanogaster) | UAS-sws | Gift from Doris Kretzschmar | UAS-sws | UAS-sws (sws gene under control of UAS promotor) |
| Genetic reagent (D. melanogaster) | sws-Gal4 | Kyoto Stock Center | 104592 | y* w* P{GawB}swsNP4072/FM7c |
| Genetic reagent (D. melanogaster) | UAS-nlsLacZ, UAS-CD8::GFP | Gift from Frank Hirth | UAS-nLacZ, UAS-GFP | UAS-nlsLacZ, UAS-CD8::GFP(nLacZ and GFP constructs under control of UAS promotor) |
| Genetic reagent (D. melanogaster) | UAS-hNTE | Gift from Robert Wessells | UAS-hNTE | w[1118]; p[PUAST]-hNTE/CyO(Human NTE undercontrol of UAS promotor) |
| Genetic reagent (D. melanogaster) | UAS-swsRNAi | Bloomington Drosophila Stock Center | BDSC 61338 | y[1] v[1]; P{y[+t7.7] v[+t1.8]=TRiP.HMJ23229}attP40 (sws RNAi construct under control of UAS promotor) |
| Genetic reagent (D. melanogaster) | repo-Gal4, UAS-CD8::GFP/TM6B | Gift from Mikael Simons | repo-Gal4 | repo-Gal4, UAS-CD8::GFP/TM6B |
| Genetic reagent (D. melanogaster) | Gliotactin-Gal4, UAS-CD8::GFP | Gift from Mikael Simons | Gli-Gal4 | Gliotactin-Gal4, UAS-CD8::GFP |
| Genetic reagent (D. melanogaster) | moody-Gal4, UAS-CD8::GFP | Gift from Mikael Simons | moody-Gal4 | moody-Gal4, UAS-CD8::GFP |
| Genetic reagent (D. melanogaster) | nSyb-Gal4 | Bloomington Drosophila Stock Center | BDSC 51945 | y[1] w[1118]; P{y[+t7.7] w[+mC]=nSyb-GAL4.DBD::QF.AD}attP2 |
| Genetic reagent (D. melanogaster) | repo-Gal4, nSyb-Gal4, UAS-CD8::GFP/TM6B,Sb | This study | repo-Gal4, nSyb-Gal4 | repo-Gal4, nSyb-Gal4, UAS-CD8::GFP/TM6B,Sb |
| Genetic reagent (D. melanogaster) | tub-Gal80ts; repo-Gal4/TM6B | This study | tub-Gal80ts; repo-Gal4/TM6B | tub-Gal80ts; repo-Gal4/TM6B(temperature sensitive) |
| Genetic reagent (D. melanogaster) | moodyΔC17 | Gift from Christian Klämbt | moodyΔC17 | Null mutant |
| Genetic reagent (D. melanogaster) | UAS-moodyRNAi | Bloomington Drosophila Stock Center | BDSC 66326 | y[1] sc[*] v[1] sev[21]; P{y[+t7.7] v[+t1.8]=TRiP.HMC06237}attP2(moody RNAi construct under control of UAS promotor) |
| Genetic reagent (D. melanogaster) | UAS-DysbRNAi | Bloomington Drosophila Stock Center | BDSC 67316 | y[1] sc[*] v[1] sev[21]; P{y[+t7.7] v[+t1.8]=TRiP.HMC06420}attP40/CyO(Dysb RNAi construct under control of UAS promotor) |
| Genetic reagent (D. melanogaster) | UAS-Npc1aRNAi | Bloomington Drosophila Stock Center | BDSC 37504 | y[1] sc[*] v[1] sev[21]; P{y[+t7.7] v[+t1.8]=TRiP.HMS01646}attP40 (Npc1a RNAi construct under control of UAS promotor) |
| Genetic reagent (D. melanogaster) | UAS-PldnRNAi | Bloomington Drosophila Stock Center | BDSC 67884 | y[1] sc[*] v[1] sev[21]; P{y[+t7.7] v[+t1.8]=TRiP.HMS05728}attP40 (Pldn RNAi construct under control of UAS promotor) |
| Genetic reagent (D. melanogaster) | UAS-spinRNAi | Bloomington Drosophila Stock Center | BDSC 27702 | y[1] v[1]; P{y[+t7.7] v[+t1.8]=TRiP.JF02782}attP2 (spin RNAi construct under control of UAS promotor) |
| Genetic reagent (D. melanogaster) | srp(Hemo) 3xmCherry | Gift from Angela Giangrande | srp(Hemo) 3xmCherry | srp(Hemo) 3xmCherry |
| Software, algorithm | Microsoft Excel | Microsoft | Microsoft Excel | |
| Software, algorithm | Adobe Photoshop | Adobe | Adobe CC | |
| Software, algorithm | Zen 2011 (black edition) | Carl Zeiss; Emmenlauer et al., 2009 | Zen 2011 | |
| Software, algorithm | AlphaFold2 v1.5.2 | Mirdita et al., 2022; https://colab.research.google.com/github/sokrypton/ColabFold/blob/main/AlphaFold2.ipynb | AlphaFold2 | |
| Software, algorithm | The PyMOL Molecular Graphics System, v2.5.5 | Schrödinger, LLC; https://pymol.org/ | PyMol | |
| Software, algorithm | StepOne Software v2.3 | Applied Biosystems | StepOne | |
| Chemical compound, drug | TRIzol reagent | Invitrogen | #15596018 | |
| Commercial assay or kit | High Capacity cDNA Reverse Transcription kit | Applied Biosystems | #4368813 | |
| Commercial assay or kit | FastSYBR Green master mix | Applied Biosystems | #435612 | |
| Chemical compound, drug | TUDCA | Sigma-Aldrich | #580549 | Tauroursodeoxycholic acid |
| Chemical compound, drug | 4-PBA | Sigma-Aldrich | #567616 | 4-Phenylbutyric acid |
| Chemical compound, drug | Valsartan | Sigma-Aldrich | #PHR1315 | |
| Chemical compound, drug | Fenofibrate | Sigma-Aldrich | #F6020 | |
| Chemical compound, drug | Sodium salicylate | Sigma-Aldrich | #S3007 | |
| Chemical compound, drug | Rapamycin | Sigma-Aldrich | #R0395 | |
| Chemical compound, drug | Deferoxamine mesylate salt | Sigma-Aldrich | #D9533 | |
| Chemical compound, drug | Liproxstatin-1 | Sigma-Aldrich | #SML1414 | |
| Chemical compound, drug | Sphingosine | Sigma-Aldrich | #860025P | |
| Chemical compound, drug | Brilliant Blue | Sigma-Aldrich | #80717 | |
| Chemical compound, drug | Acetic acid | Sigma-Aldrich | #27225-1L-M | |
| Chemical compound, drug | Chloroform | Sigma-Aldrich | #288306-2L | |
| Chemical compound, drug | Glycerol | Sigma-Aldrich | #G6279-1L | |
| Chemical compound, drug | Sodium azide | Sigma-Aldrich | #S2002-25G | |
| Chemical compound, drug | Formaldehyde, 16% | Polysciences Inc | #18814-20 | Methanol free, ultra pure |
| Other | 10 kDa Dextran | Molecular Probes | #D1864 | Dye labeled with Texas Red |
| Other | DAPI stain | Sigma-Aldrich | #D9542-10MG | IF concentration used: 1 µg/mL |
| Other | Normal Goat Serum | Abcam | #ab7481 | |
| Other | Paraplast Plus | Sigma-Aldrich | #76258-1KG | |
| Other | Casein Blocking Buffer 10× | Sigma-Aldrich | #B6429-500ML | |
| Other | Hematoxylin Solution, Mayer’s | Sigma-Aldrich | #MHS16-500ML | |
| Other | Eosin Y solution, aqueous | Sigma-Aldrich | #HT110232 | |
| Other | DPX Mountant for histology | Sigma-Aldrich | #06522-100ML | |
| Other | PBS buffer (10× Dulbecco's) | AppliChem | #A0965,9010 | |
| Other | LSM700 confocal laser-scanning microscope | Carl Zeiss | LSM700 | |
| Other | Hyrax M25 microtome | Carl Zeiss | Hyrax M25 | |
| Other | Zeiss EM 900 microscope | Carl Zeiss | Zeiss EM 900 | |
| Other | Step One Plus 96 well system | Applied Biosystems | Step One Plus | |
| Chemical compound, drug | Acetonitrile | Honeywell | #34851 | |
| Chemical compound, drug | Toluene | Supelco | #1.08325.1000 | |
| Chemical compound, drug | Pentafluoro-benzyl bromide | Sigma-Aldrich | #101052 | |
| Chemical compound, drug | Diisopropyl-ethylamine | Sigma-Aldrich | #496219 | |
| Commercial assay or kit | GC-MS ISQ | Thermo Fisher | Trace 1210 series | |
| Commercial assay or kit | Optima 17 | Macherey-Nagel | #MN726022.15 | |
| Chemical compound, drug | C12:0; C12:1; C14:0; C14:1; C16:0; C16:1; C17:0; C17:1; C18:0; C18:1; C18:2; C18:3; C20:4; C20:5; C21:0; C22:0; C24:0 | Merck (Darmstadt, Germany) | ||
| Chemical compound, drug | C19:1; C20:0; C21:1 | Larodan AB (Solna, Sweden) | ||
| Chemical compound, drug | Paraformaldehyde | Merck | #1.04005.1000 | |
| Chemical compound, drug | Glutaraldehyde | Merck | #1.04239.0250 | |
| Chemical compound, drug | Osmiumtetroxide | Electron Microscopy Sciences | #22400-56 | |
| Chemical compound, drug | HEPES | Roth | #7020.2 | |
| Chemical compound, drug | Acetone puriss.p.a. ACS reagent, reag.ISO 99, 5% | Sigma-Aldrich | #:32201-2.5 | |
| Chemical compound, drug | Agar 100 Premix Kit – Hard | Agar Scientific | #R1140 | |
| Chemical compound, drug | Tri-Natriumcitrat-Dihydrat | Merck | #1-06448.0500 | |
| Chemical compound, drug | Lead (II) nitrate for analysis | Merck | #1.07398.0100 |
Additional files
-
Supplementary file 1
Relative mRNA levels.
a – the ΔCT value is determined by subtracting the average CT value of endogenous control gene(Rpl32) from the average mRNA CT value. b –the calculation of ΔΔCT involves subtraction by the ΔCT calibrator value (ΔCT value in control). c – the range is given for relative levels determined by evaluating the expression: 2–ΔΔCT. AVE ± SEM values are reported from experiments done in at least duplicates. Two-tailed Student’s test was used to test for statistical significance. pa – compared to the relevant control. pb – compared to 15-day-old animals of the same genotype. pc – compared to sws1 mutant of the same age.
- https://cdn.elifesciences.org/articles/98020/elife-98020-supp1-v2.docx
-
Supplementary file 2
NTE/SWS expression in the surface glia is important for the integrity of Drosophila blood-brain barrier (BBB).
a – compared to control (OR x w1118). b – compared to Gal4-driver x OR. c – compared to Gal4-driver x UAS-swsRNAi. The values are reported from experiments done in triplicates. For statistical analyses of the observed phenotypes, two-way tables and chi-squared test were used.
- https://cdn.elifesciences.org/articles/98020/elife-98020-supp2-v2.docx
-
Supplementary file 3
NTE/SWS deficit in the surface glia results in the accumulation of Rab7- and CathepsinL-positive structures.
a – compared to Gal4-driver x OR animals of the same age. b – compared to 1-day-old animals of the same genotype. The values are reported from experiments done in triplicates. For statistical analyses of the observed phenotypes, two-way tables and chi-squared test were used.
- https://cdn.elifesciences.org/articles/98020/elife-98020-supp3-v2.docx
-
Supplementary file 4
NTE/SWS deficit in the surface glia results in permeable blood-brain barrier (BBB).
a – compared to control (OR x w1118). b – compared to Gal4-driver x OR. c –compared to Gal4-driver x UAS-swsRNAi. The values are reported from experiments done in triplicates. For statistical analyses of the observed phenotypes, two-way tables and chi-squared test were used.
- https://cdn.elifesciences.org/articles/98020/elife-98020-supp4-v2.docx
-
Supplementary file 5
The effect of treatment with different anti-inflammatory substances and stress suppressors on the frequency of the surface glia phenotype in sws and moody mutants.
a – compared to sws1 (no drug treatment)b – compared to moody ΔC17 (no drug treatment). The values are reported from experiments done in triplicates. For statistical analyses of the observed phenotypes, two-way tables and chi-squared test were used.
- https://cdn.elifesciences.org/articles/98020/elife-98020-supp5-v2.docx
-
Supplementary file 6
Mutants with defective BBB show upregulated levels of free fatty acids (FFA).
(a) sws and moody mutants show upregulated levels of free fatty acids (FFAs). For statistical analyses one-way ANOVA test was used. C14:1–9-cis-Tetradecenoic acid. C16:0 – Palmitic acid. C16:1 – Palmitoleic acid. C18:0 – Stearic acid. C18:1 – Oleic acid. C18:2 – Linoleic acid. C18:3 – α- and γ-Linolenic acid. C20:0 – Eicosanoic acid. C20:4 – Arachidonic acid. C20:5 – Eicosapentaenoic acid. (b) sws and moody mutants show upregulated levels of free fatty acids (FFAs). Summary of the ions monitored in the selected-ion monitoring (SIM) modeSIM#1 (12.00–14.50 min): m/z 197.4, 199.4, 225.4, 227.4, 253.4, 255.4, 267.4, 269.4. SIM#2 (14.50–15.00 min): m/z 281.4, 283.4, 279.4, 295.4, 297.4. SIM#3 (15.00–17.00 min): m/z 301.4, 303.4, 309.4, 311.4, 325.4, 337.4, 339.4, 365.4, 367.4.
- https://cdn.elifesciences.org/articles/98020/elife-98020-supp6-v2.docx
-
MDAR checklist
- https://cdn.elifesciences.org/articles/98020/elife-98020-mdarchecklist1-v2.docx
Download links
A two-part list of links to download the article, or parts of the article, in various formats.
Downloads (link to download the article as PDF)
Open citations (links to open the citations from this article in various online reference manager services)
Cite this article (links to download the citations from this article in formats compatible with various reference manager tools)
Unraveling the link between neuropathy target esterase NTE/SWS, lysosomal storage diseases, inflammation, abnormal fatty acid metabolism, and leaky brain barrier
eLife 13:e98020.
https://doi.org/10.7554/eLife.98020


