Structural mechanisms for VMAT2 inhibition by tetrabenazine
- Department of Structural Biology, University of Pittsburgh, United States
- Laufer Center for Physical and Quantitative Biology, and Department of Biochemistry and Cell Biology, School of Medicine, Stony Brook University, United States
Figures
Figure 1 with 3 supplements
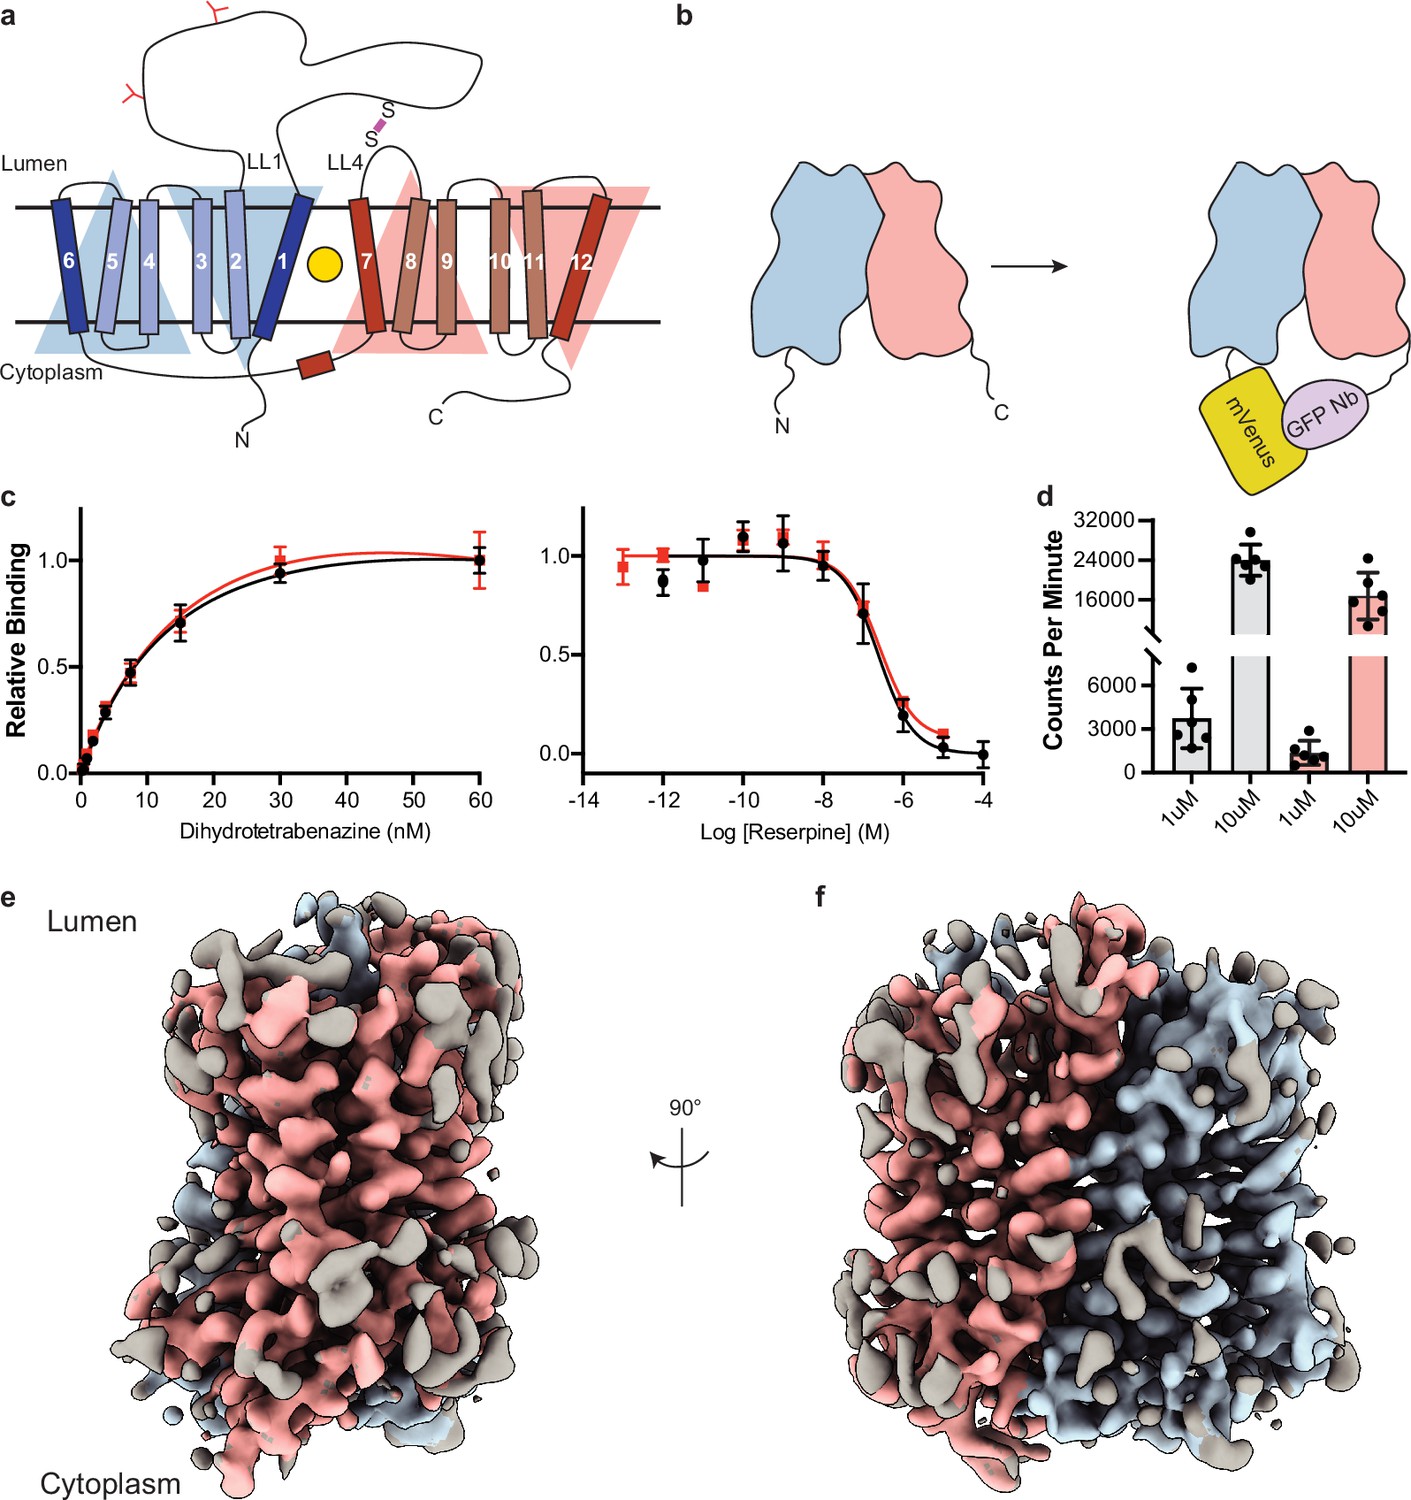
Cryo-electron microscopy (cryo-EM) reconstruction and functional characterization of vesicular monoamine transporter 2 (VMAT2)-tetrabenazine complex.
(a) Predicted structural elements of VMAT2. The neurotransmitter substrate is bound at the central site (yellow, circle) between the two repeats comprised of transmembrane (TM)1–6 and 7–12. The red and blue triangles depict the pseudo twofold symmetric repeats. A disulfide bond (purple line) is predicted between lumenal loops LL1 and LL4. The N-linked glycosylation sites in LL1 are shown as red ‘Y’ shapes. (b) Intrinsic fiducial strategy involves attachment of mVenus and GFP-Nb to the N- and C-terminus of VMAT2. (c) Left panel, plots of [3H]-DTBZ saturation binding to wild-type VMAT2 (black, circles) and chimera (red, squares). Symbols show the mean derived from n=3 technical replicates. Error bars show the s.e.m. Right panel, graphs of competition binding of 3H-DTBZ with unlabeled reserpine, error bars show the s.e.m. DTBZ, dihydrotetrabenazine. (d) Plots of transport into vesicles using 1 and 10 µM 3H-serotonin for wild-type VMAT2 (gray bars) and chimera (red bars). The bars show the means and points show the value for each technical replicate. Error bars show the s.e.m. (e, f) Occluded map of VMAT2-tetrabenazine complex (3.1 Å resolution, contour level 0.336). The mVenus and GFP-Nb fiducial is not shown for clarity.
Figure 1—figure supplement 1
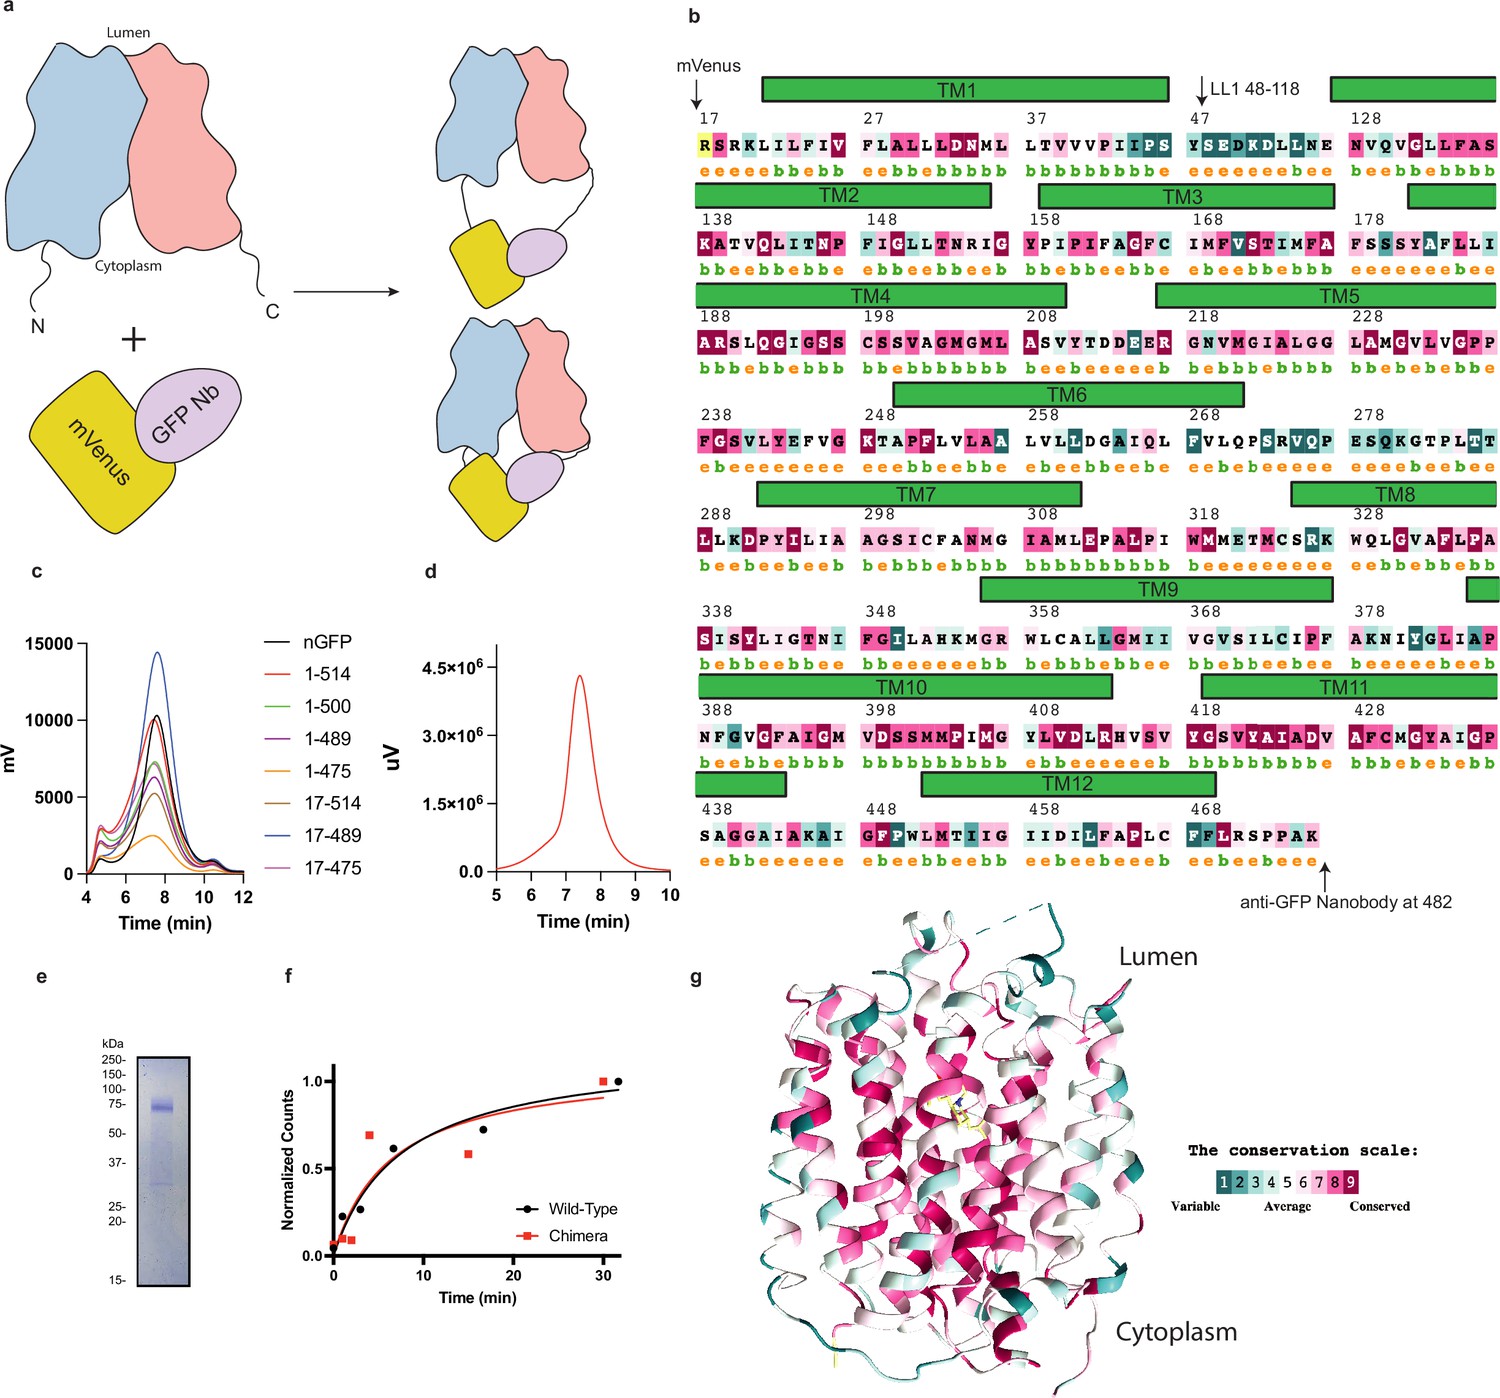
Biochemical characterization, construct design, and sequence conservation of vesicular monoamine transporter 2 (VMAT2).
(a) The mVenus and GFP-Nb was fused to the N- and C-terminus of VMAT2 and the length of the termini is varied to find constructs which can be studied by cryo-electron microscopy (cryo-EM) and retain functional activity. (b) Sequence and secondary structure prediction. The position of the various transmembrane helices and the position of mVenus and GFP-Nb are shown. (c) Screening of various constructs by FSEC. (d) The SEC profile of the 17–481 chimera exhibits a single monodisperse peak. (e), SDS-PAGE gel showing purified VMAT2 chimera which migrates as an ~75 kDa species. (f) Time course accumulation of serotonin in vesicles using 1 µM 3H-serotonin for wild-type (black trace) and chimera (red trace). (g) VMAT2 colored by sequence variation from different species, using the ConSurf server (Carlsson et al., 1957).
Figure 1—figure supplement 2
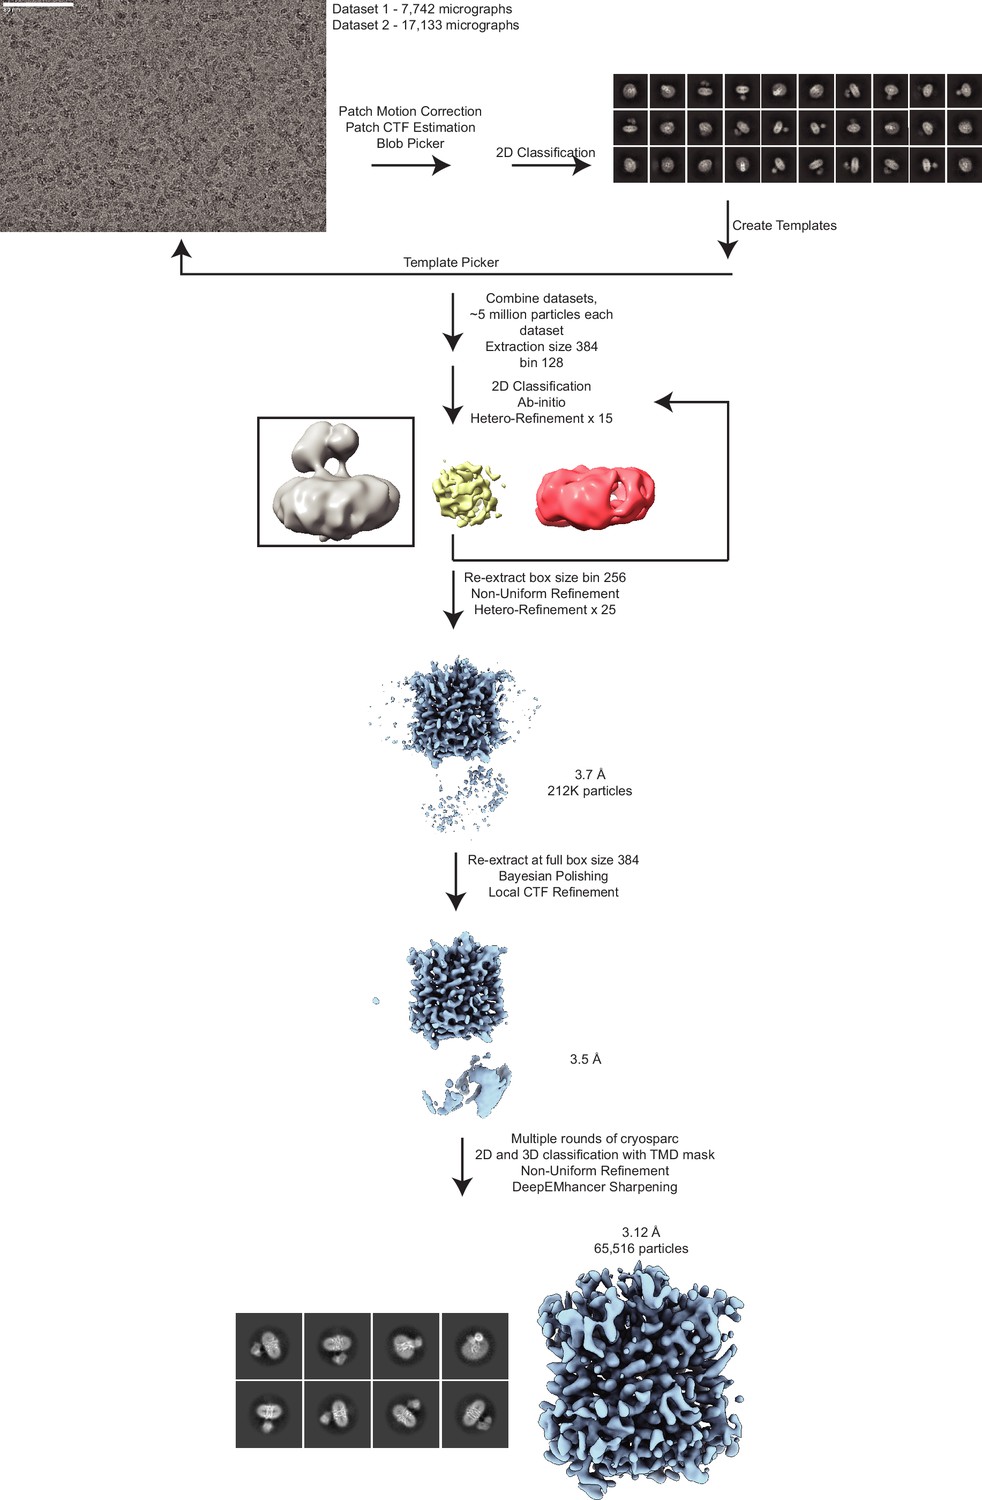
Cryo-electron microscopy (cryo-EM) data processing of the vesicular monoamine transporter 2 (VMAT2)-tetrabenazine complex.
A representative micrograph (defocus –1.3 µm) is shown (scale bar equals 80 nm). The workflow depicts the data processing scheme used to reconstruct VMAT2. Two datasets were collected comprising 7742 and 17,133 micrographs, respectively. Videos were corrected for drift using patch motion correction in CryoSPARC (Punjani et al., 2017) and resultant micrographs were used to estimate defocus and pick particles. Blob picking followed by template picking was utilized to select approximately 5 million particles from each dataset. 2D classification was used to sort particles and the sorted particles were subjected to ab initio reconstructions to obtain initial reference. Next, all of the particles picks from each dataset were subjected to multiple rounds of heterogeneous classification/refinement with the ab initio VMAT2 map and two ‘decoy’ classes (yellow, a spherical blob, and red, empty detergent micelle) starting with a box size of 128 pixels, followed by subsequent rounds of classification at box size of 256. This resulted in approximately 212k particles after combining both datasets. Particles were then extracted at full box size 384 before Bayesian polishing in RELION (Scheres, 2012) and local CTF refinement in CryoSPARC (Punjani et al., 2017). The resulting 3.5 Å map was then subjected to CryoSPARC 3D classification using a transmembrane domain (TMD) mask (Punjani et al., 2017). The final stack of 65k particles was then subjected to local refinement to produce the final unsharpened map. DeepEMhancer was used to locally sharpen the map for interpretation (Sanchez-Garcia et al., 2021).
Figure 1—figure supplement 3
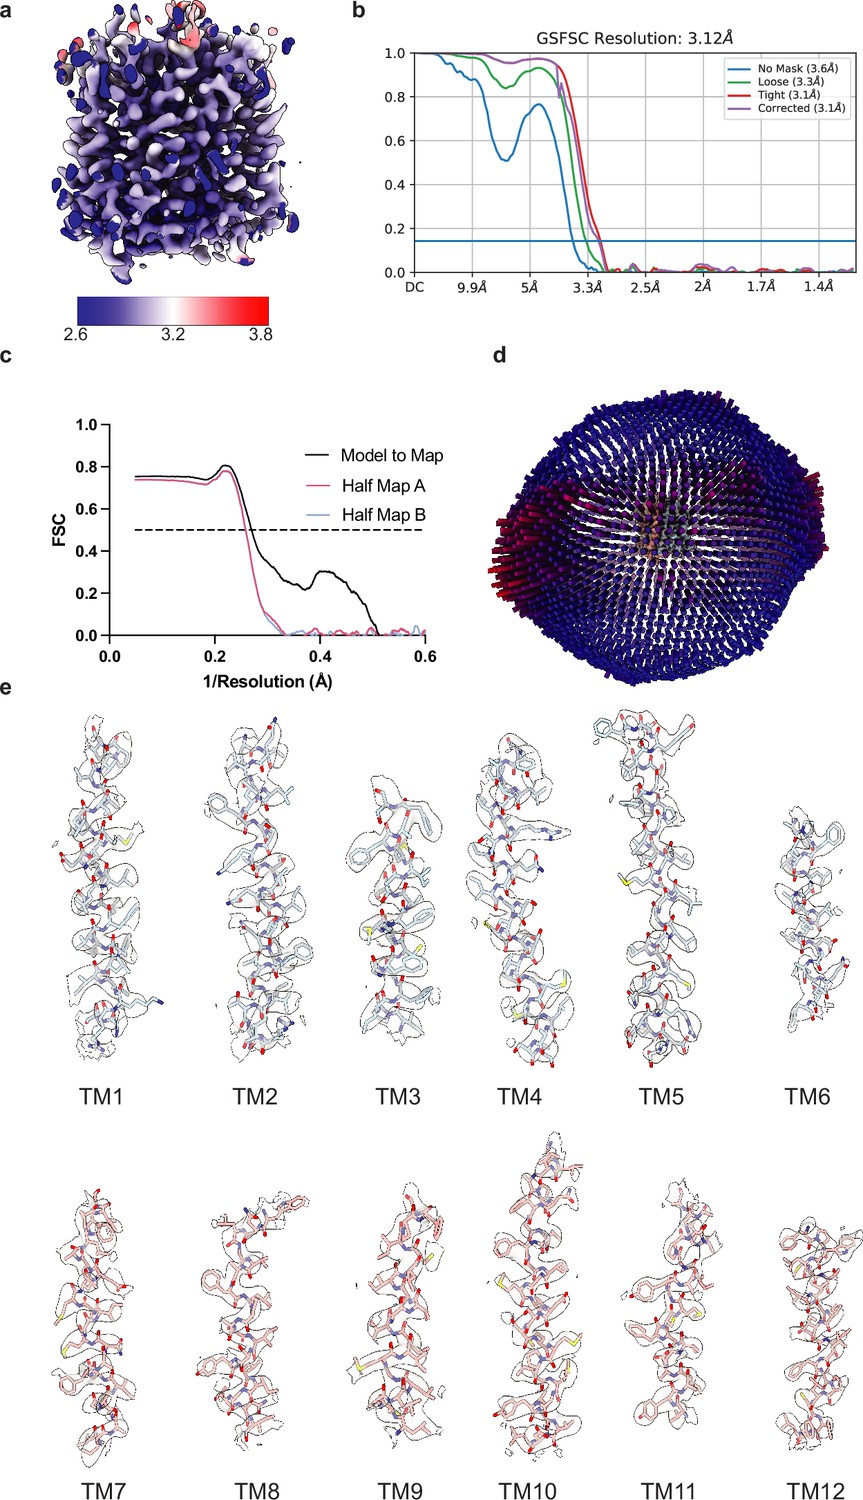
Cryo-electron microscopy (Cryo-EM) maps and interpretation of vesicular monoamine transporter 2 (VMAT2) reconstruction.
(a) Cryo-EM density colored by local resolution estimation. (b) FSC curves for cross-validation, the unmasked map (blue), loose mask (green), tight mask (red), and the reported corrected (purple) curves. The dotted line indicates an FSC value of 0.143. (c) FSC curves for model versus half map 1 (working, red), half map 2 (free, blue), and model versus final map (black). (d) Angular distribution of particles used in the final reconstruction. (e) Cryo-EM density segments of transmembrane (TM)1 to TM12.
Figure 2 with 1 supplement
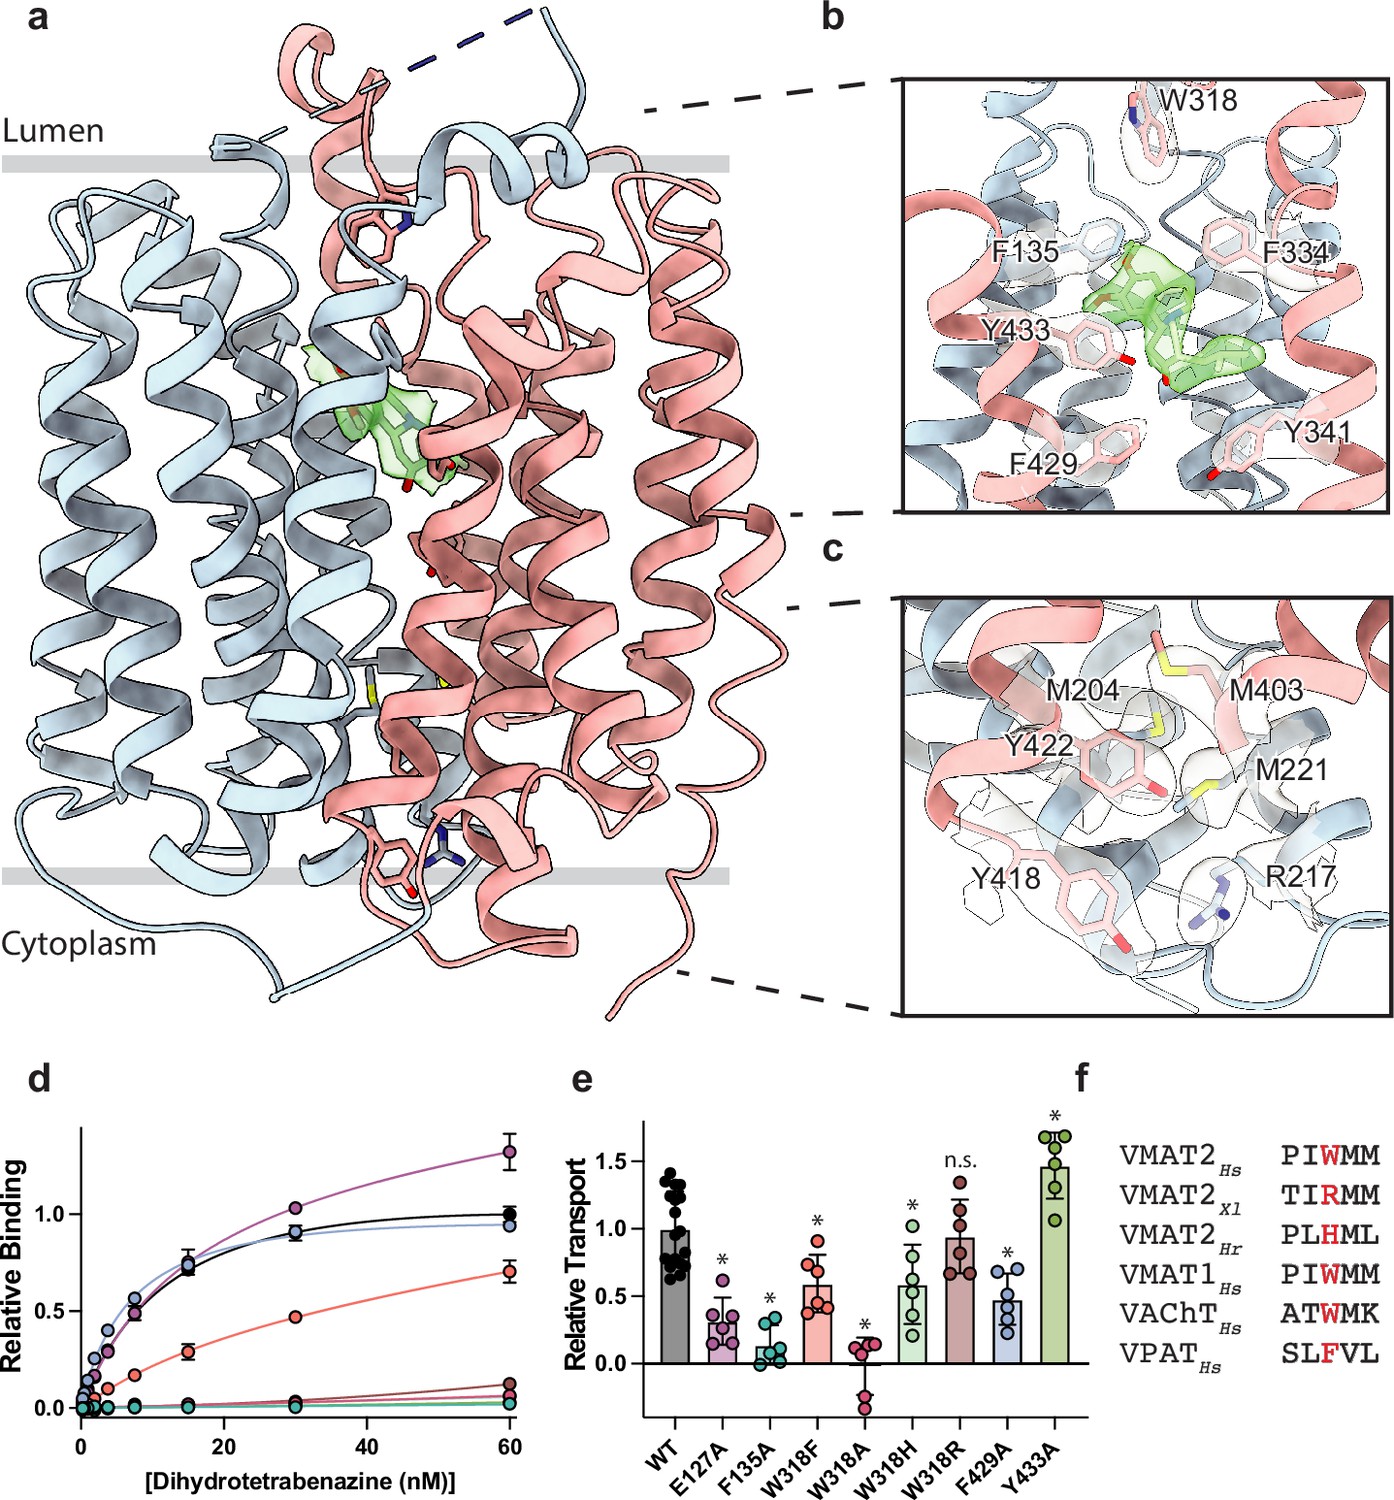
Vesicular monoamine transporter 2 (VMAT2) conformation and residues involved in gating.
(a) Overall view of the VMAT2-tetrabenazine (TBZ) complex. TBZ is shown in light green sticks with its map density in transparent surface. (b) Closeup view of lumenal gating residues and TBZ, shown in stick representation together with transparent surface representation of their map density. (c) Cytosolic gating residues, same representation as in (b). (d) Binding of dihydrotetrabenazine (DTBZ) to various VMAT2 mutants in the lumenal and cytosolic gates including wild type (black), W318R (brown), W318H (light green), E127A (purple), W318F (orange), Y433A (forest green), F429A (blue), W318A (red), and F135A (teal). Data were normalized to wild type with error bars denoting standard deviation. (e) Serotonin transport activity of lumenal and cytosolic gating residue mutants. Symbols show the mean derived from n=6 technical replicates with an identical color scheme to (d). Asterisks denote statistical significance from wild type, with no significance being denoted with n.s. Data were normalized to wild-type transport. Statistics were calculated in GraphPad Prism using a one-way ANOVA with Dunnett’s multiple comparison test. Error bars show the standard deviation. (f) Alignment of five sequential residues of human VMAT2 (two residues on either side of W318) against their counterparts in Xenopus laevis (Xl), Helobdella robusta (Hr), and VMAT1, VAChT, and VPAT from humans. The residues which align with W318 in VMAT2 are shown in red.
Figure 2—figure supplement 1
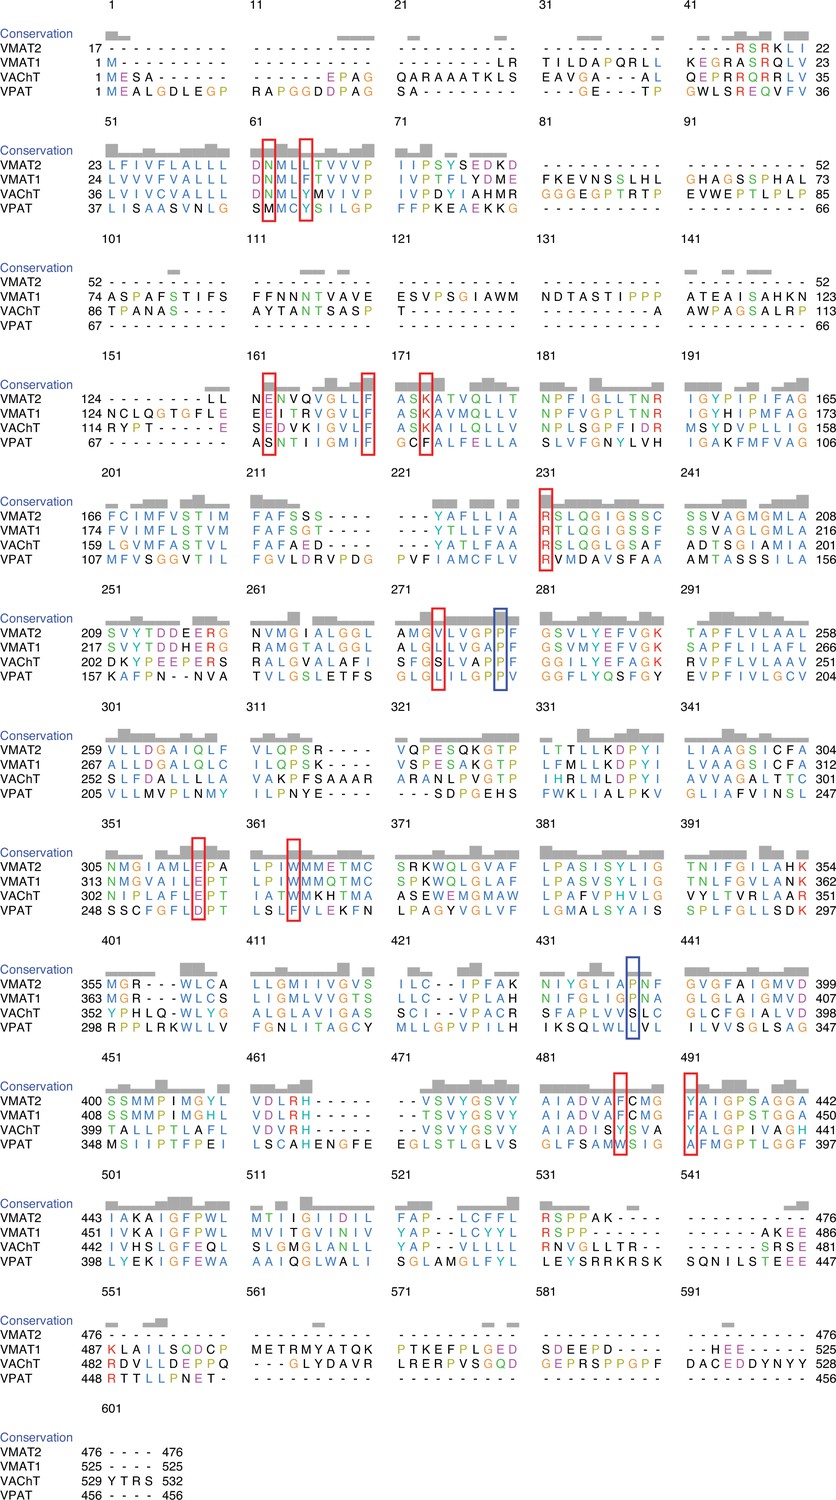
Sequence alignment of vesicular monoamine transporter 1 (VMAT1), VMAT2, VAChT, and VPAT.
The positions of mutated residues are shown in red boxes. The human variants are shown in blue boxes (Yariv et al., 2023; Pei et al., 2008).
Figure 3
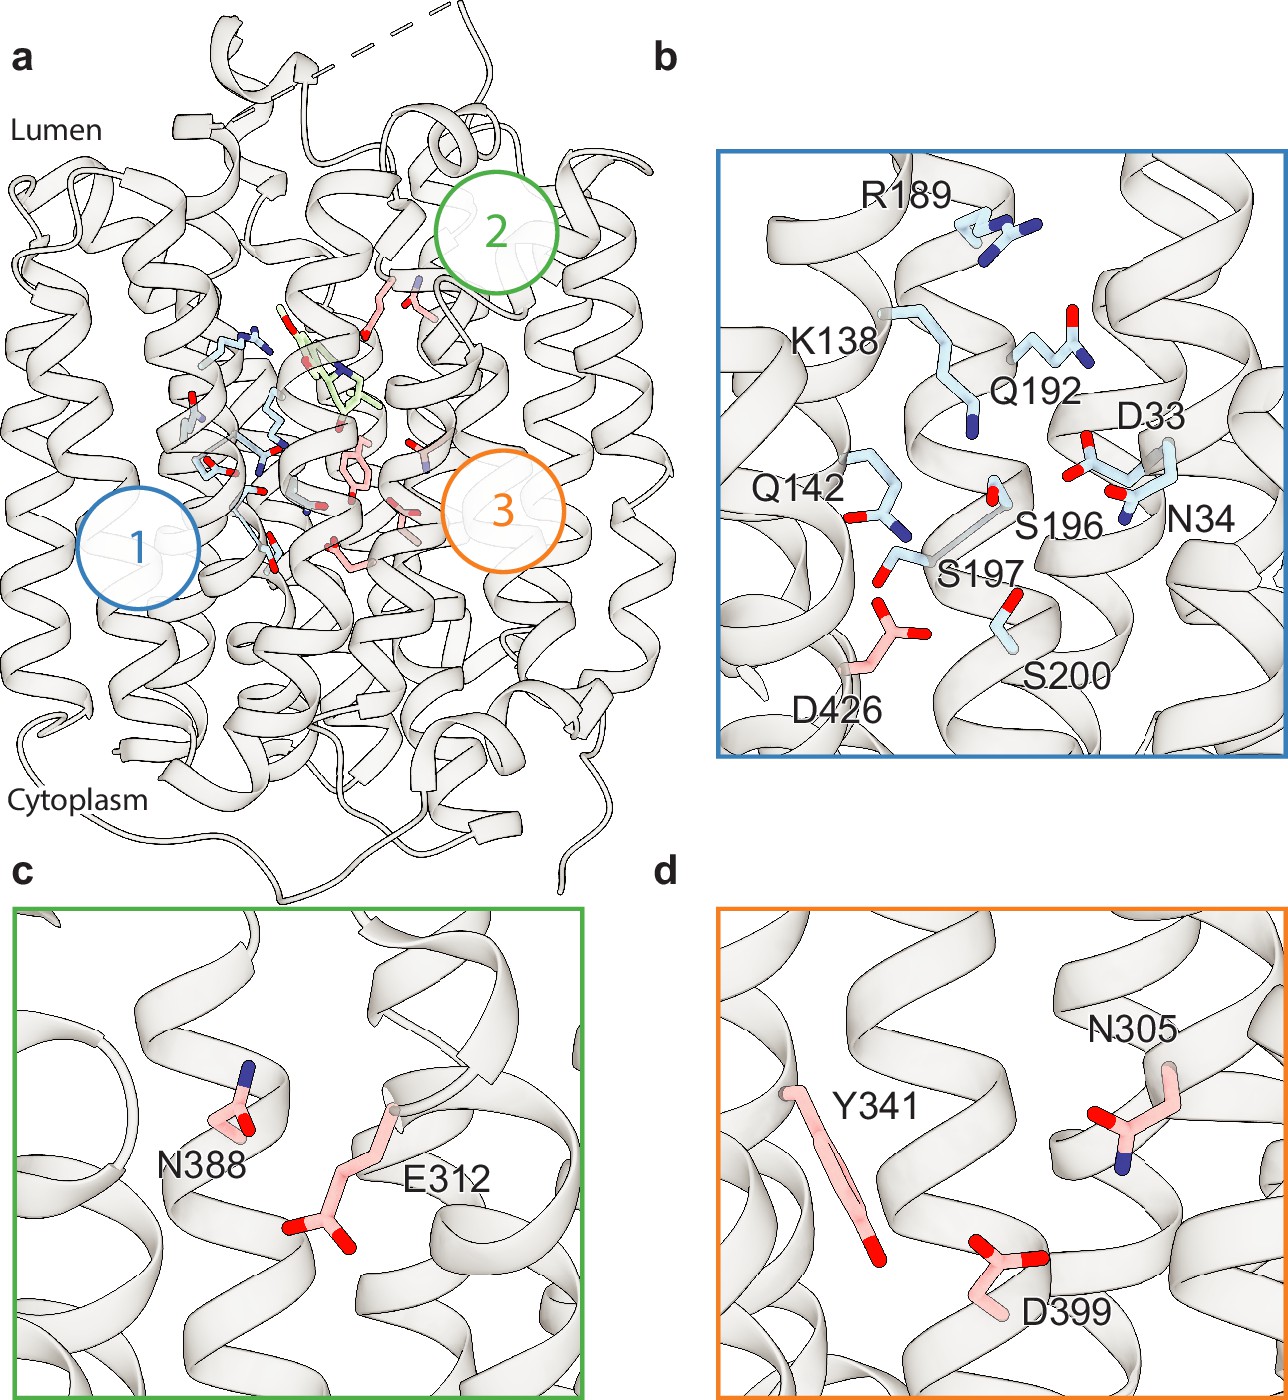
Polar networks.
(a) Overall view showing three distinct polar networks. Polar residues involved in each network and tetrabenazine (TBZ) are shown in sticks. (b) Cartoon representation showing a zoomed view of polar network 1. (c) Polar network 2. (d) Polar network 3.
Figure 4 with 6 supplements
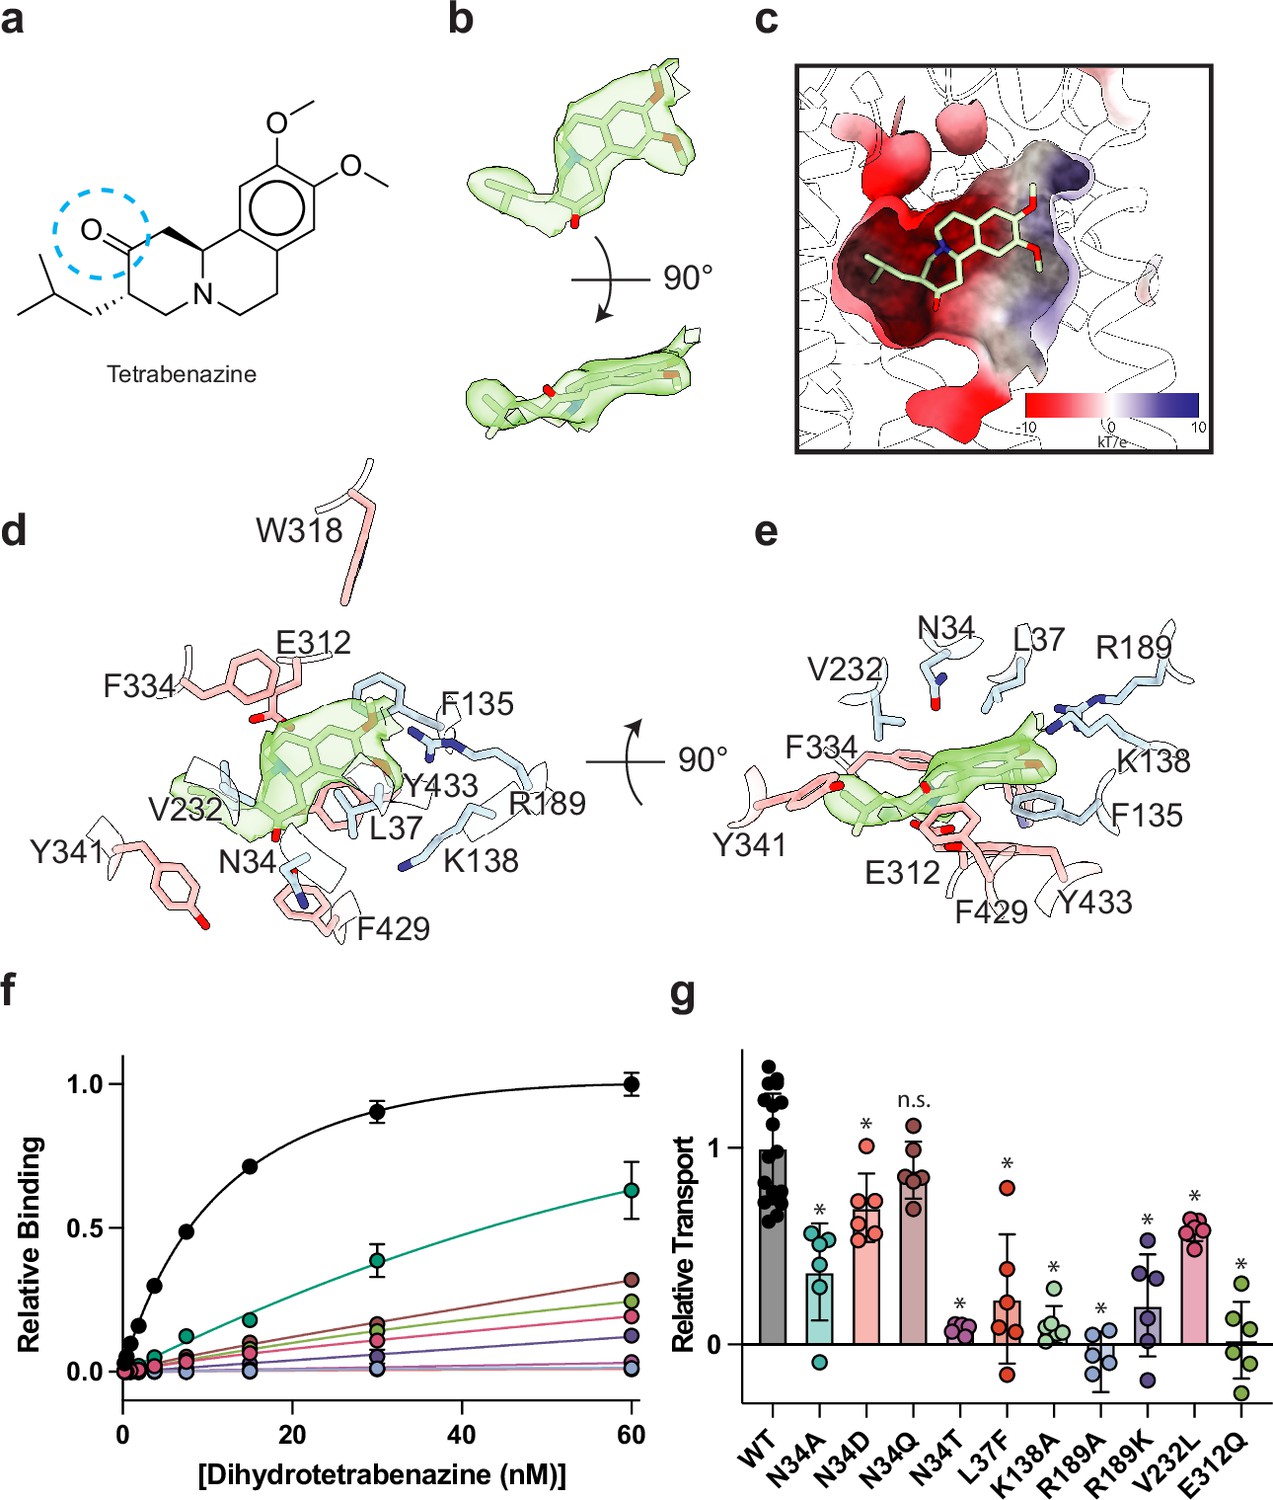
Tetrabenazine (TBZ) recognition and binding.
(a) Chemical structure of TBZ. The blue dotted circle indicates the position of the hydroxyl group in dihydrotetrabenazine (DTBZ). (b) Density associated with TBZ is shown in green transparent surface sharpened with a B-factor of –50 Å2. TBZ is shown in sticks fit to the density. (c) Electrostatic potential of the TBZ binding site. (d, e) Binding site of TBZ, residues which are involved in binding are shown in sticks. Density associated with TBZ is shown in light green surface. (f) Plots of 3H-DTBZ saturation binding to wild type (black), V232L (pink), R189A (blue), E312Q (forest green), N34D (orange), N34T (light purple), N34A (teal), N34Q (brown) R189K (purple) L37F (red), and K138A (light green). (g) Serotonin transport activity of mutants in TBZ binding site. Symbols show the mean derived from n=6 technical replicates with an identical color scheme to f. Asterisks denote statistical significance from wild type, with no significance being denoted with n.s. Statistics were calculated in GraphPad Prism using a one-way ANOVA with Dunnett’s multiple comparison test. Error bars show the s.e.m.
Figure 4—figure supplement 1
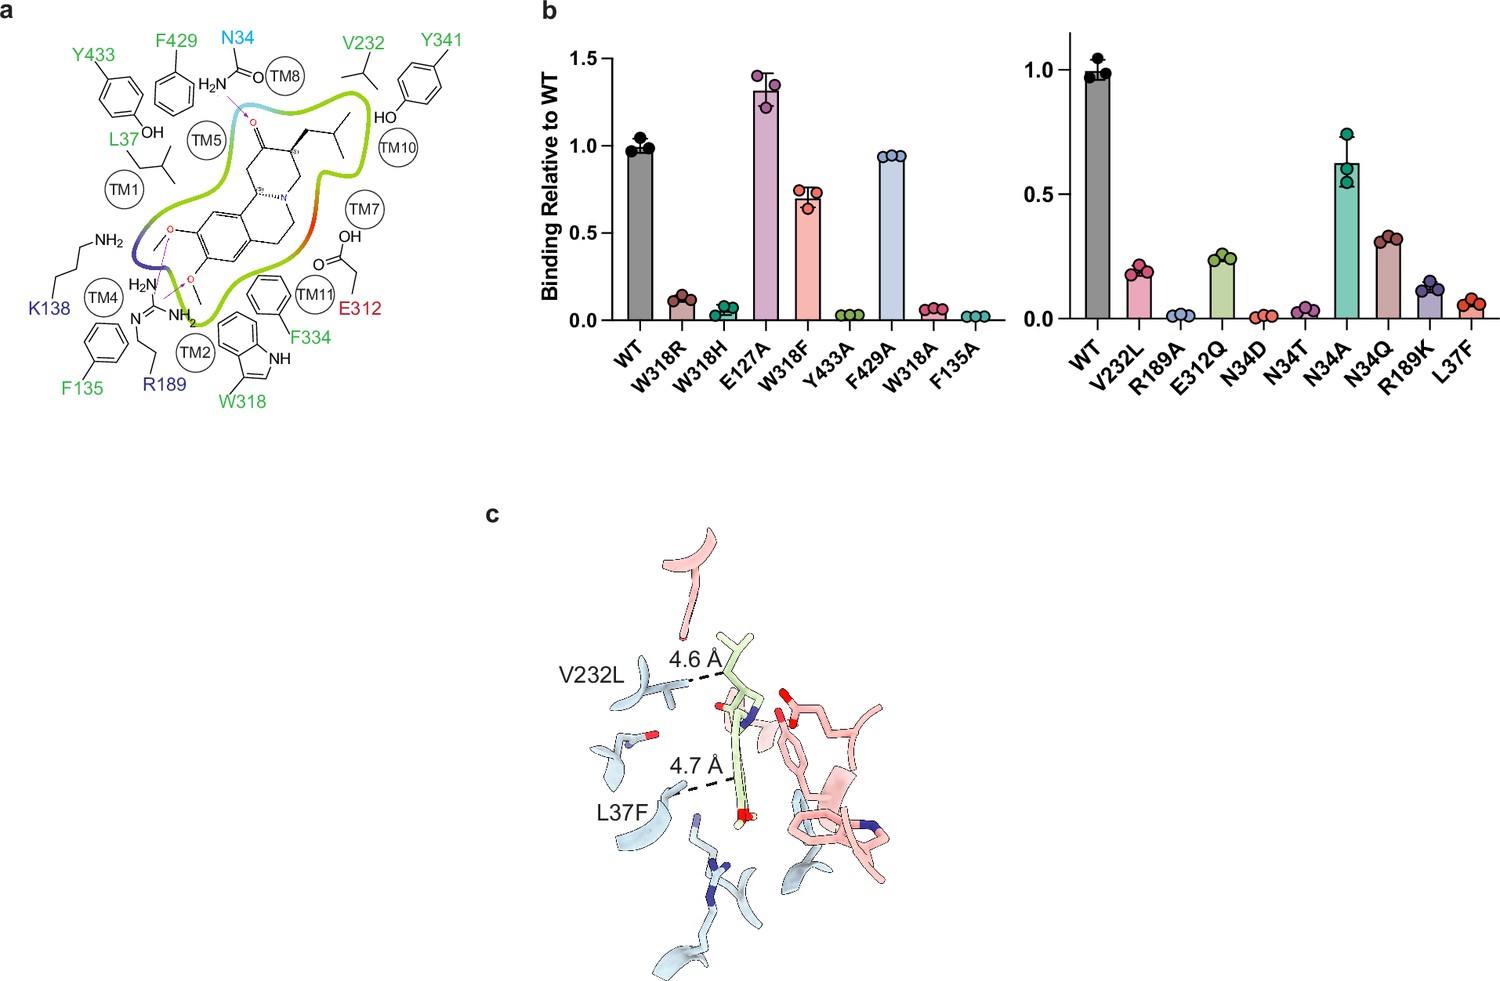
Point mutants in tetrabenazine (TBZ) binding site.
(a) 2D cartoon of the TBZ binding site showing only highlighted residues. Green, red, and blue indicate hydrophobic, negatively, or positively charged properties of the side chains (Schrödinger, 2023) (a). (b) Plots of binding of 60 nM of [3H]-DTBZ. The bars show the means and points show the value for each technical replicate. Error bars show the s.e.m. (c) Binding site showing the positions of L37 and V232 which are a phenylalanine and a leucine in vesicular monoamine transporter 1 (VMAT1), respectively. DTBZ, dihydrotetrabenazine.
Figure 4—figure supplement 2
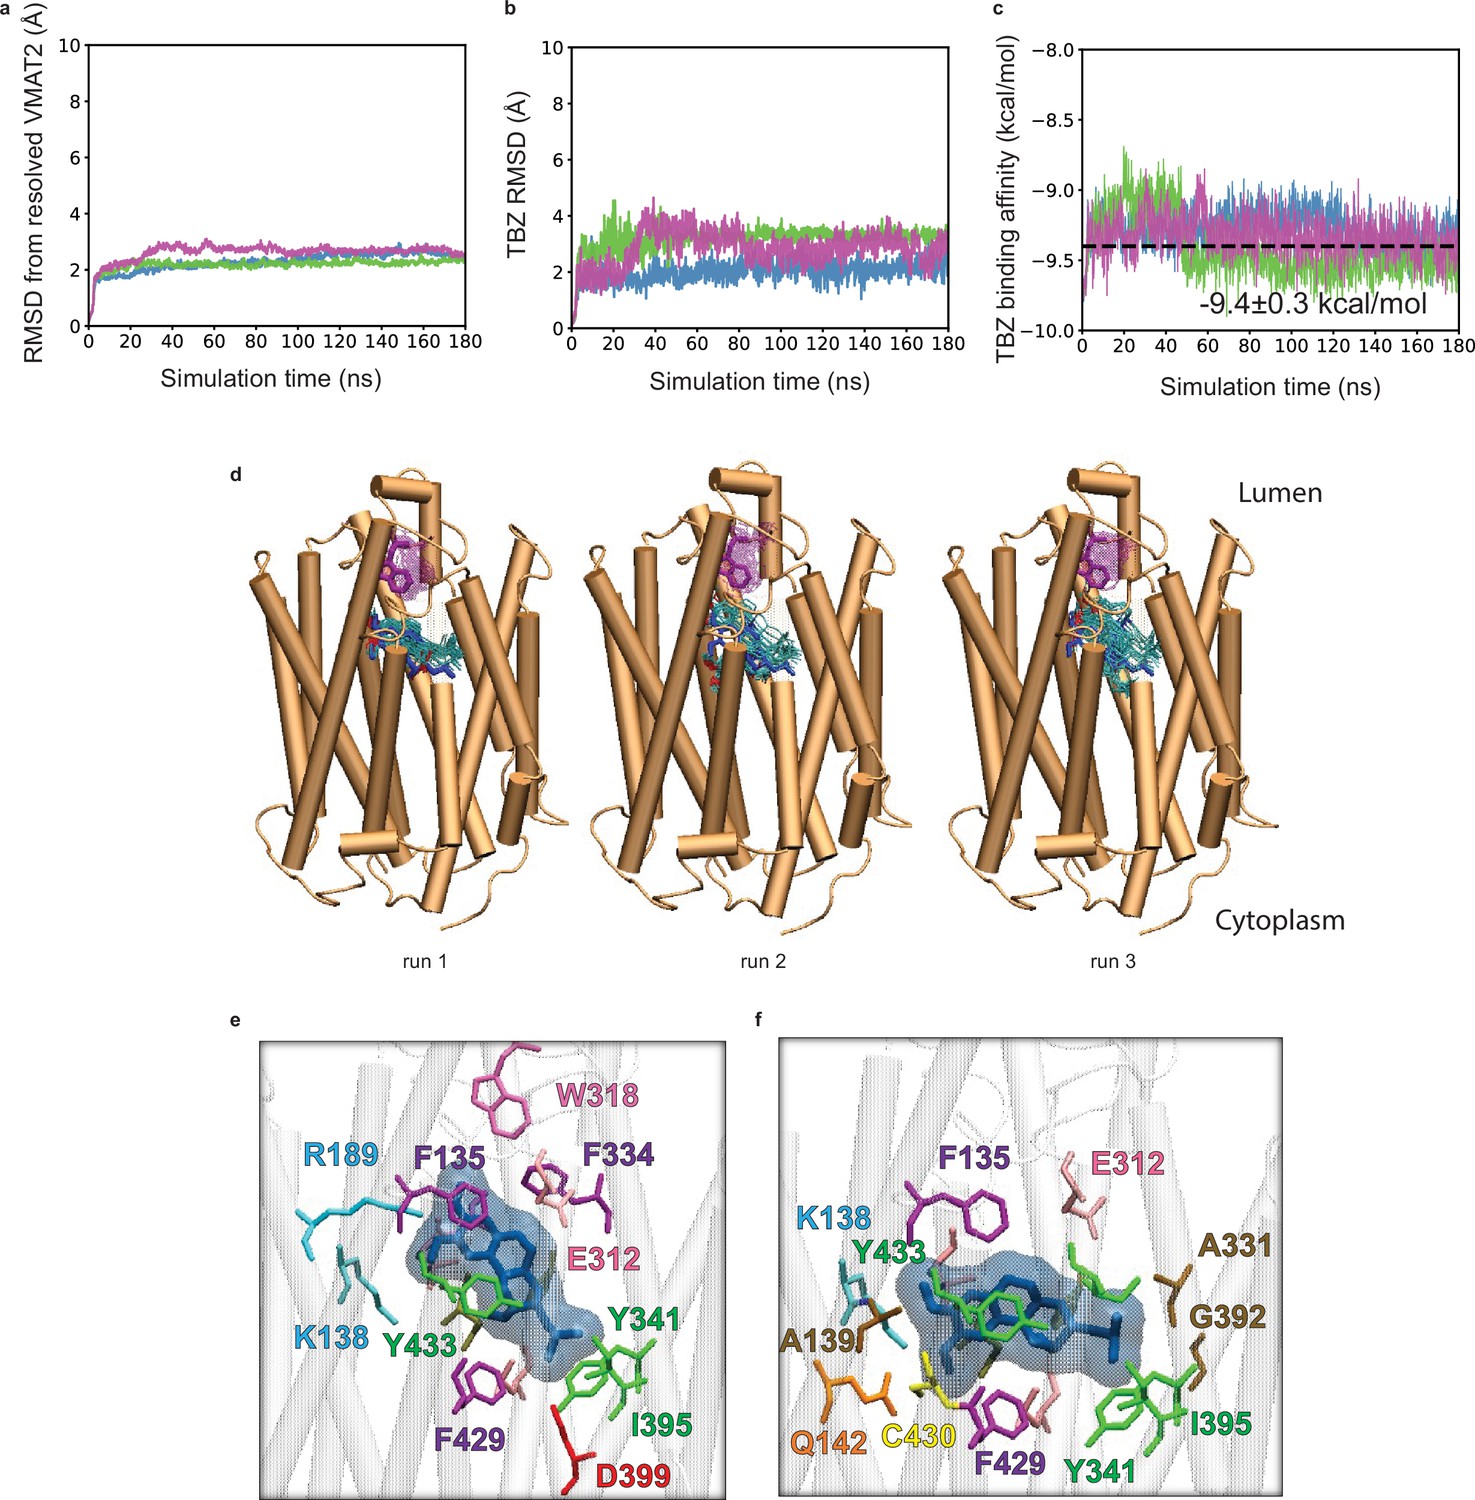
Tetrabenazine (TBZ) docking and molecular dynamics (MD) simulations.
(a–c) Time evolution of (a) root-mean-square-deviations (RMSDs) in vesicular monoamine transporter 2 (VMAT2) Cα-coordinates from those resolved in the cryo-electron microscopy (cryo-EM) structure, (b) RMSD for TBZ heavy atoms, and (c) TBZ binding affinities, observed in three different runs conducted for the TBZ_1 system (see Table 3). Binding affinities were calculated using PRODIGY-LIG. (d) The TBZ binding poses and variations of W318 captured in these MD simulations, with a snapshot taken every 4 ns and a total of 50 frames are shown from 0 to 100 ns for each run. The ligand conformations are shown in cyan sticks with blue stick illustrating cryo-EM-resolved binding pose. The variations of W318 are displayed in purple sticks with dark purple showing the cryo-EM-resolved orientation. Docking simulations of TBZ onto VMAT2 revealed two poses, shown in the panels (e) and (f). The former, captured in runs 1 and 3, is almost identical (RMSD of 0.4 Å) to the cryo-EM-resolved pose, illustrated in panel (e). The latter, captured in run 2, differs from the cryo-EM pose by 3.0 Å.
Figure 4—figure supplement 3
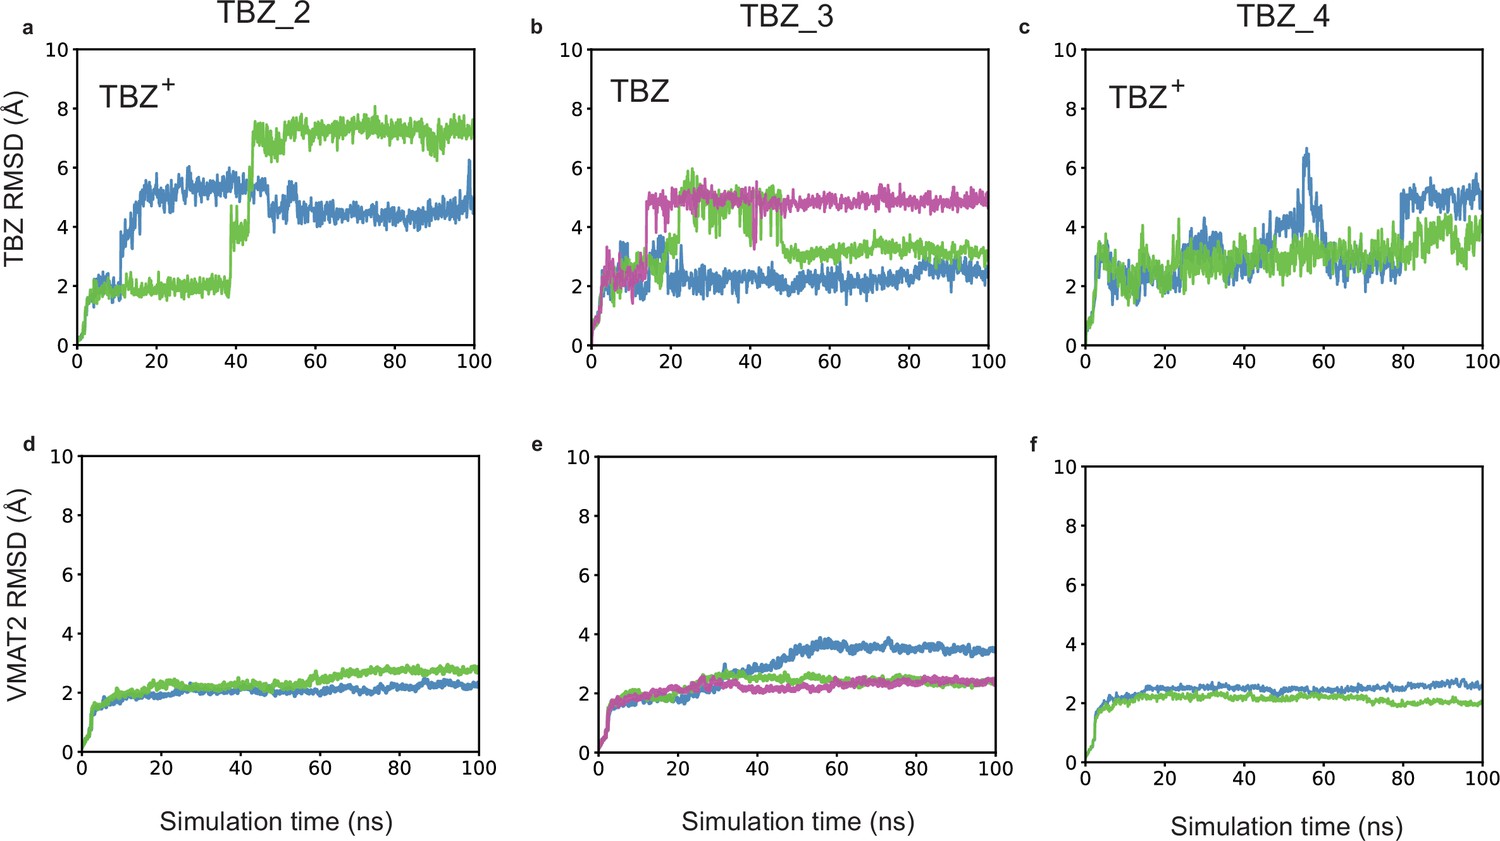
Effects of protonation states of tetrabenazine (TBZ) and selected vesicular monoamine transporter 2 (VMAT2) residues on the time evolution of TBZ (heavy atoms) and VMAT2 (α-carbons) root-mean-square-deviations (RMSDs) from their original (cryo-electron microscopy [cryo-EM]-resolved) positions.
Results are presented for three different types of simulations (TBZ_2–TBZ-4; see Table 3). In each case, the top panels (a), (b), and (c) display the RMSDs in the heavy atoms of TBZ and the lower panels (d), (e), and (f) display the RMSDs in the Cα-atoms of VMAT2. Multiple runs are displayed by curves in different colors.
Figure 4—video 1
Binding and coordination of neutral tetrabenazine (TBZ) (cyan van der Waals [vdW] representation) observed in a 180 ns molecular dynamics (MD) simulation (run 1).
Three runs were performed for vesicular monoamine transporter 2 (VMAT2) embedded in a lipid bilayer in the presence of TBZ, where E312 and D399 were protonated. We focus here on the time evolution of TBZ coordination, hence the naming of the runs as TBZ_1 run 1, TBZ_1 run 2, and TBZ_1 run 3. Movie S1 displays TBZ_1 run 1. For each snapshot, water molecules (in CPK format; ball and stick) within 4 Å of TBZ are shown; and acidic, basic, hydrophilic, and hydrophobic residues within 4 Å of TBZ are displayed in red, blue, green, and orange licorice representations, respectively. The predominant pose adopted by TBZ is closely similar to that resolved in our cryo-electron microscopy (cryo-EM) structure, and illustrated in Figure 4—figure supplement 2e. See Table 3 for the description of the runs.
Figure 4—video 2
Binding and coordination of neutral tetrabenazine (TBZ) (cyan van der Waals [vdW] representation) observed in a 180 ns molecular dynamics (MD) simulation (TBZ_1 run 2), in the same format as Figure 4—video 1.
TBZ slightly altered its position within the same binding pocket, to stabilize the pose illustrated in Figure 4—figure supplement 2f.
Figure 4—video 3
Binding and coordination of neutral tetrabenazine (TBZ) (cyan van der Waals [vdW] format) observed in a 180 ns molecular dynamics (MD) simulation (TBZ_1 run 3), in the same format as Figure 4—video 1.
TBZ adopts a pose similar to that resolved in the cryo-electron microscopy (cryo-EM) structure.
Figure 5 with 2 supplements
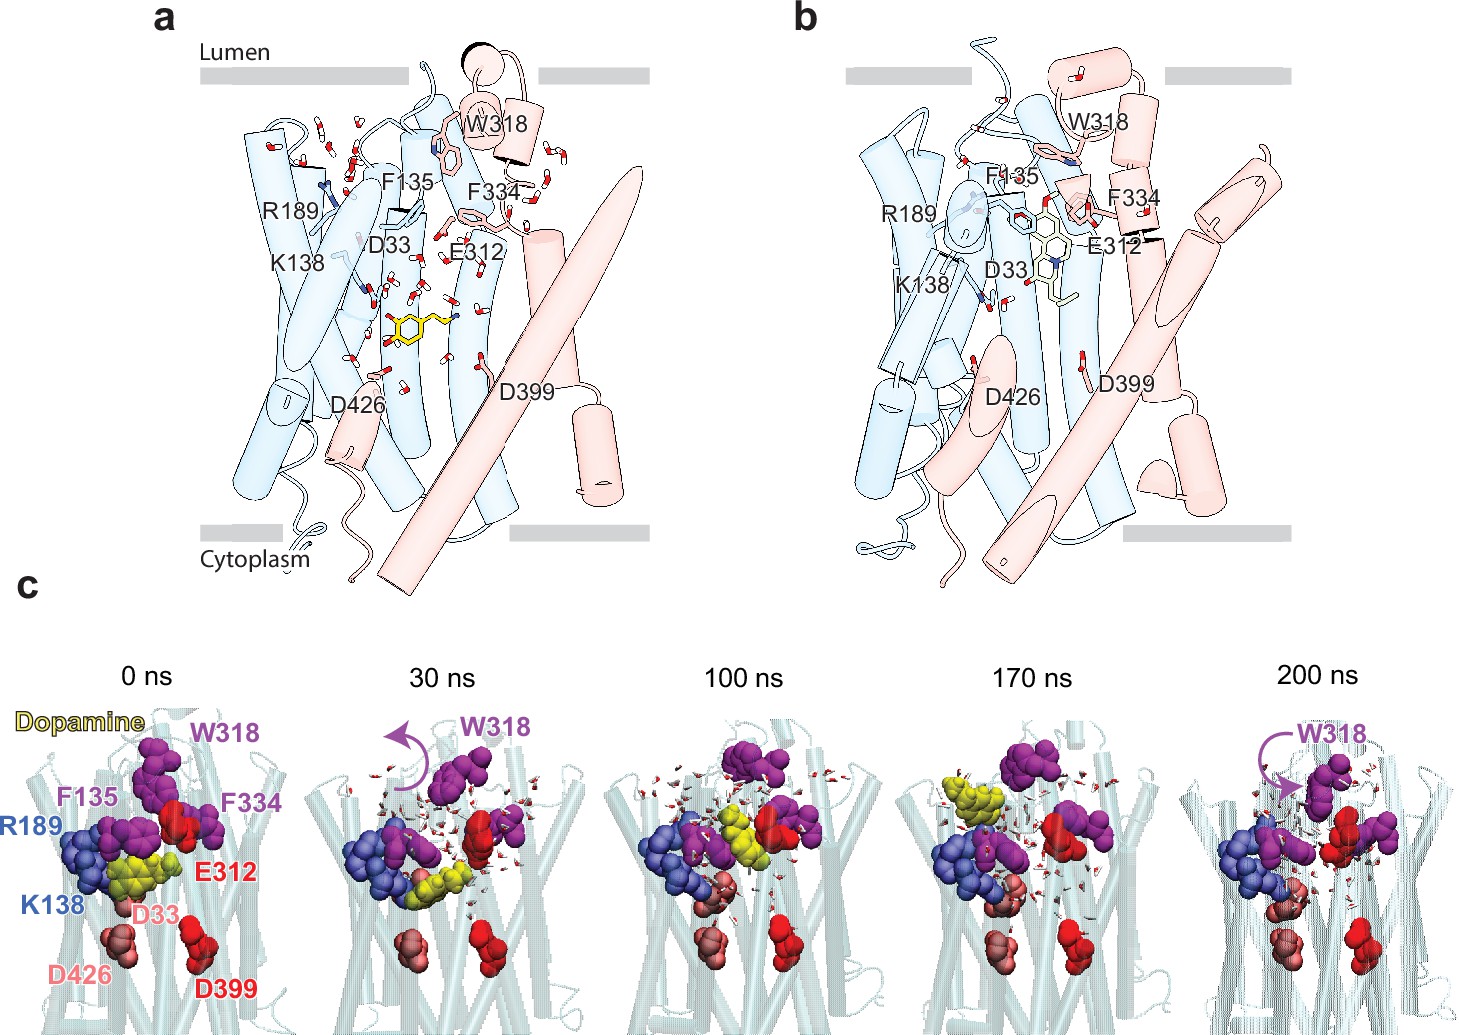
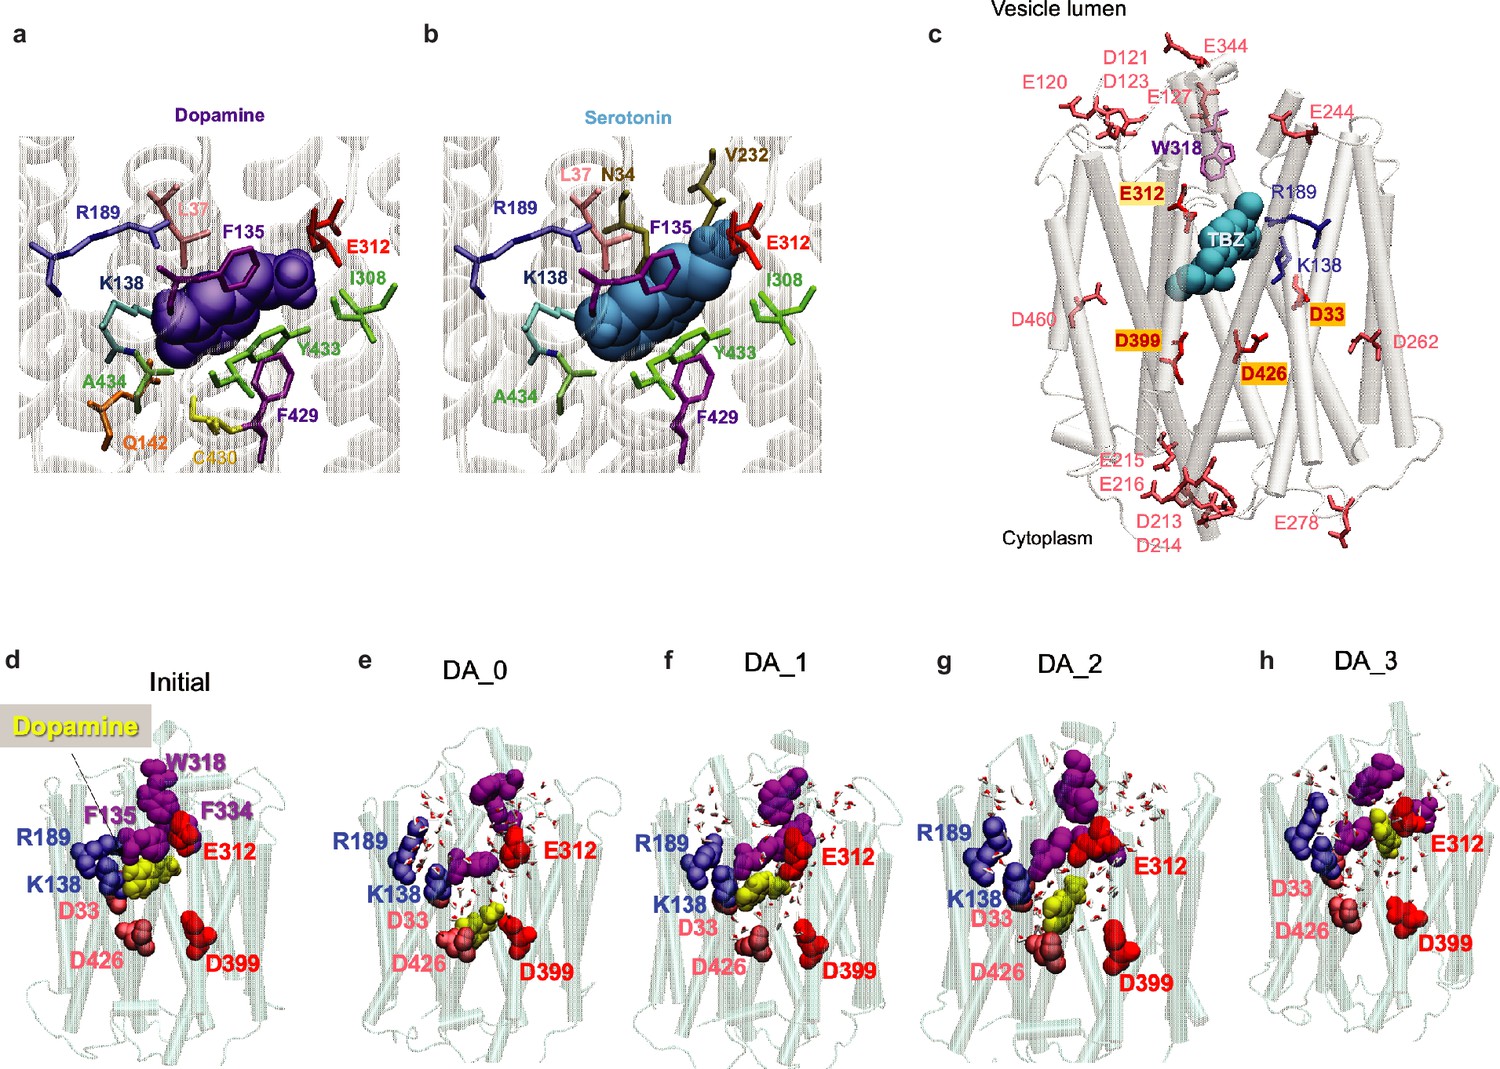
Release of dopamine (DA) from the occluded binding site to the lumen through the lumen-facing vestibule and concurrent conformational changes in vesicular monoamine transporter 2 (VMAT2).
Comparison of (a) DA (yellow sticks) and (b) tetrabenazine (TBZ) (green sticks) binding to VMAT2, captured by molecular dynamics (MD) simulations. Two water pathways are observed in the MD simulations of VMAT2 bound to DA (run DA_2 in Table 5). Water molecules and key residues are shown in sticks. (c) Positions of DA (yellow van der Waals [VDW] spheres) with respect to hydrophobic gate composed of F135, W318, and F334 (purple VDW spheres), and charged residues lining the binding pocket at t=0, 30, 100, 170, and 200 ns. W318 side chain isomerization plays a critical role in mediating the opening/closure of the hydrophobic gate, accompanied by the reorientation of F135 side chain, permitting a flux of water molecules eventually giving rise to the destabilization and release of DA to the synaptic vesicle (SV) lumen by translocating through a hydrated channel. Waters within 10 Å radius from the center of mass (COM) of the hydrophobic gate residues are displayed.
Figure 5—figure supplement 1
Comparisons of binding poses of substrate (dopamine [DA] and serotonin) and inhibitor (tetrabenazine [TBZ]) from docking simulations and molecular dynamics (MD) simulations under different protonation states of substrate-coordinating and/or gating residues.
(a) Docking of DA and (b) serotonin to the cryo-electron microscopy (cryo-EM)-resolved vesicular monoamine transporter 2 (VMAT2). The most energetically favorable poses are shown for both substrates. Residues within 4 Å of the ligand are shown in sticks. DA and serotonin are displayed in violet and cyan as van der Waals (vdW) surfaces. In both cases, the amine group (of either substrate) is in close contact with E312 and the hydroxyl group interacts with R189. (c) Resolved 3D positions of aspartates and glutamates in VMAT2. (d) DA binding pose to the cryo-EM-resolved VMAT2 conformer (initial). (e–h) DA binding poses captured by 100 ns MD simulations of system DA_0 (f) in which none of the four acidic residues D33, E312, D399, and D426 were protonated and DA bound to D399; DA_1 (g) in which D399 was protonated and DA bound to E312; DA_2 (i), in which E312 and D399 were protonated; and DA_3 (h) in which E312, D399, and D426 were protonated. DA is shown in yellow vdW spheres around 100 ns, along with hydrophobic gate residues F135, W318, and F334 (purple vdW spheres), and charged residues lining the binding pocket. Waters within 10 Å radius from the center of mass (COM) of the hydrophobic gate residues are displayed.
Figure 5—video 1
Release of dopamine (DA) to the vesicular lumen (yellow van der Waals [VDW] spheres), observed after protonating D33, E312, D399, and D426 (red vdW spheres). Related to Figure 5.
The video represents a 200 ns molecular dynamics (MD) simulation of system DA_4 in Table 5.
Figure 6 with 2 supplements
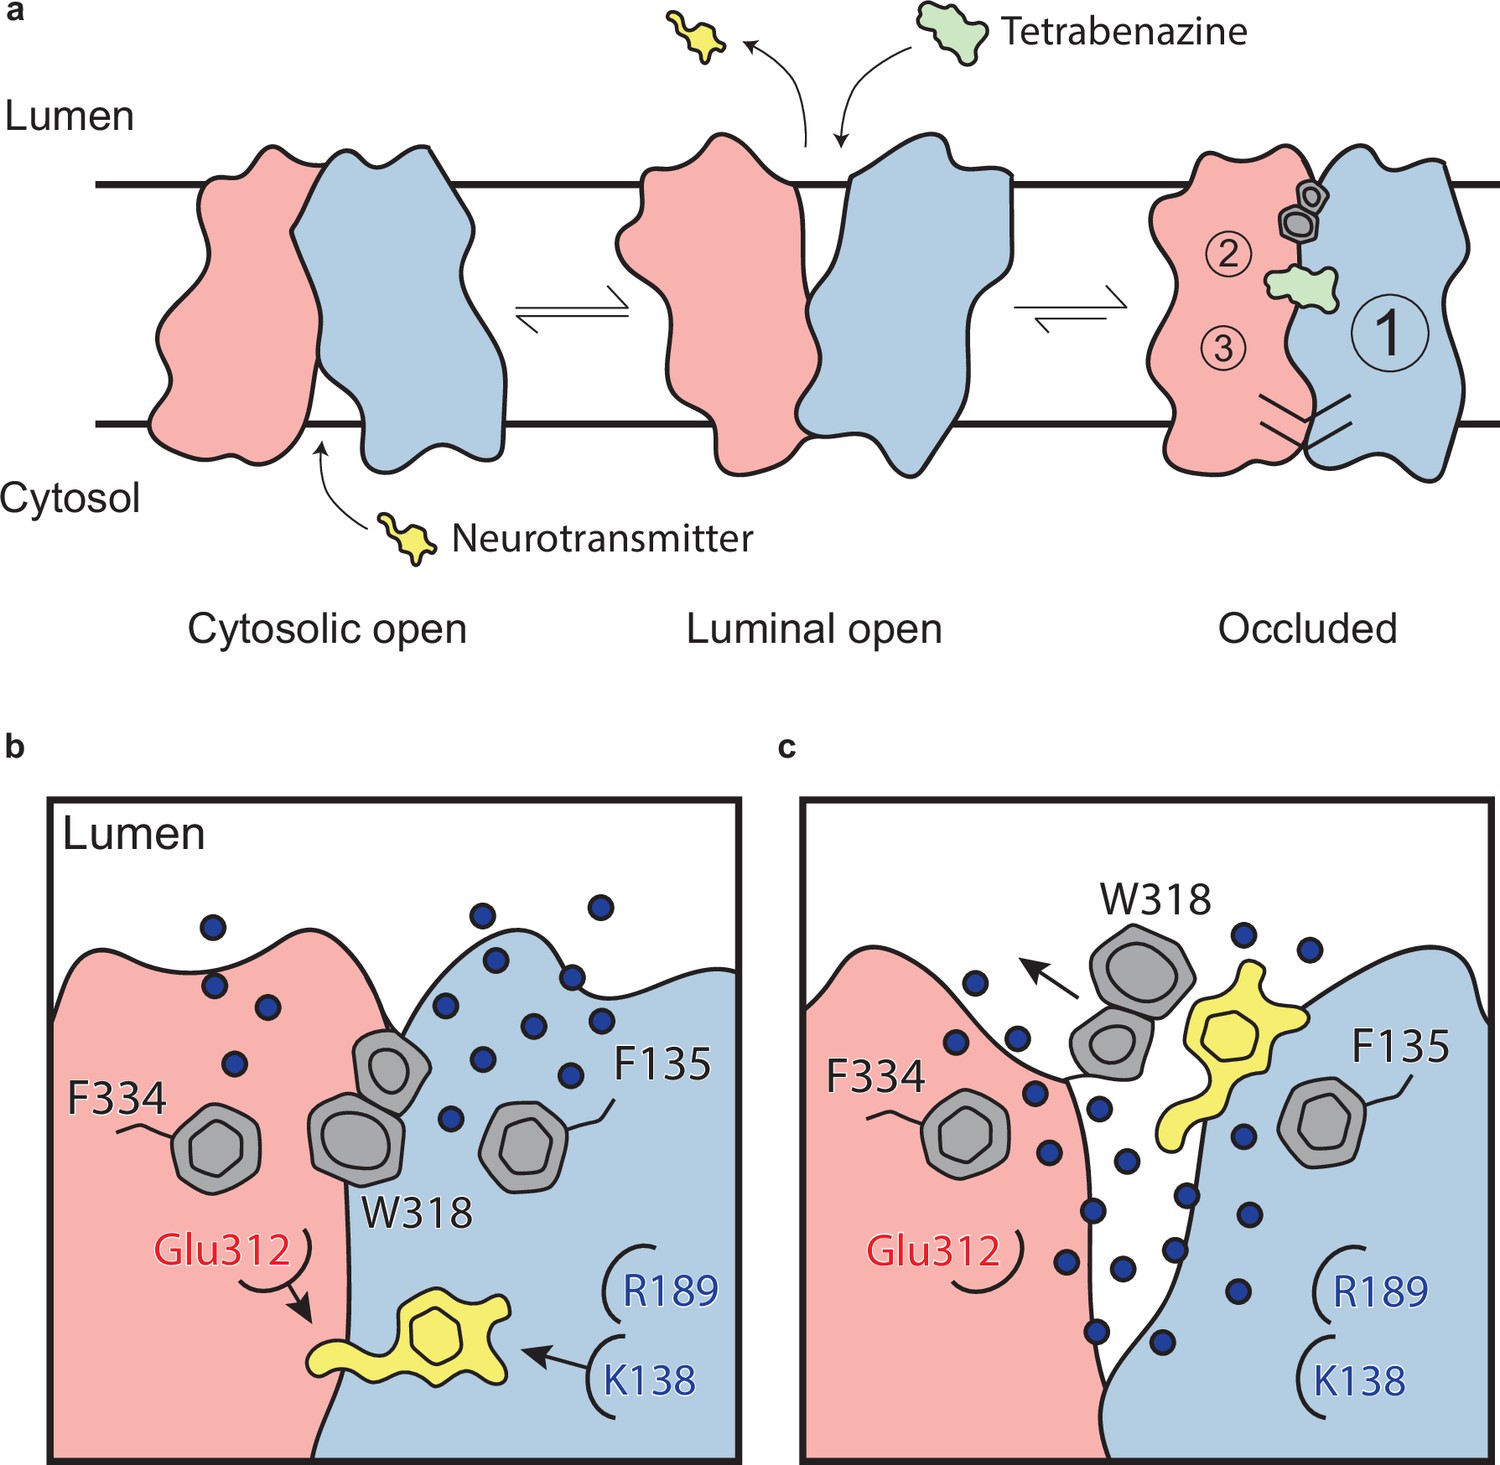
Mechanism of tetrabenazine inhibition, and the roles of gating residues and polar interactions networks.
(a) Cartoon depicting substrate transport and tetrabenazine binding to vesicular monoamine transporter 2 (VMAT2). Neurotransmitter (yellow cartoon) binds to the cytosolic-open conformation before being released from the transporter in the lumenal-open state. Tetrabenazine (green cartoon) binds to the lumenal-facing state and induces a conformational change to a high-affinity occluded conformation which is the resolved cryo-electron microscopy (cryo-EM) structure reported in this work. The VMAT2–tetrabenazine complex highlighting significant features including both cytosolic (slashes) and lumenal gates (hexagon and pentagon depicting W318), the three polar networks (numbered circles) and relative location of the tetrabenazine binding site (green). (b) Water penetrating through two pathways is involved in opening the lumenal gate. Dopamine is shown in yellow cartoon. (c) Opening of W318 is associated with neurotransmitter release.
Figure 6—figure supplement 1
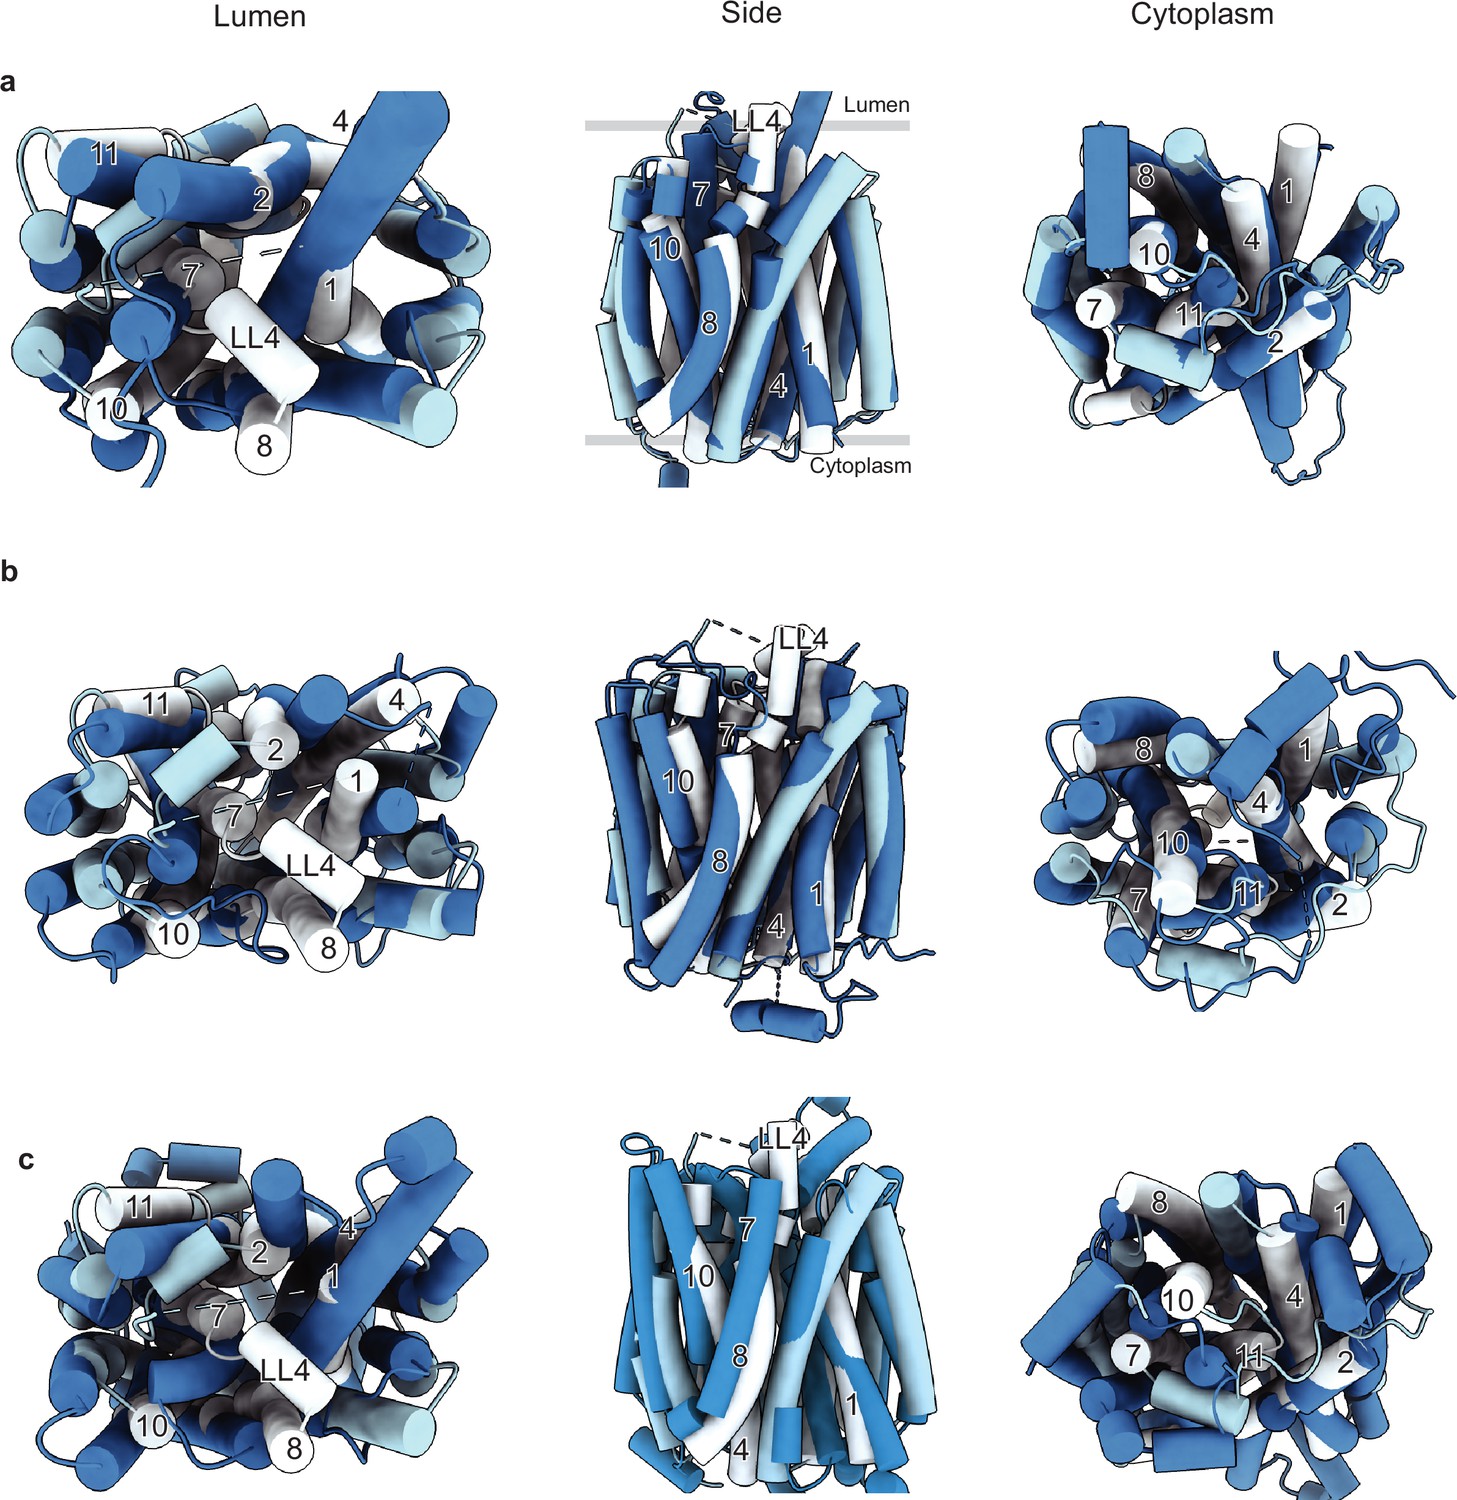
Comparison of the vesicular monoamine transporter 2 (VMAT2)-tetrabenazine (TBZ) structure with the predicted AlphaFold structure and with other major facilitator superfamily (MFS) transporters.
(a) Comparison of the cryo-electron microscopy (cryo-EM) structure (light blue) vs. AlphaFold (navy). The position of TM1, -2, -4, -7, -8, -10, and -11 and LL4 in the cryo-EM structure shows the most substantial differences and is shown in white for clarity. (b) Comparison with the outward-open VGLUT2 structure (PDB: 8SBE) shown in navy. (c) Comparison with the inward-open GLUT4 structure (PDB: 7WSM) shown in navy.
Figure 6—figure supplement 2
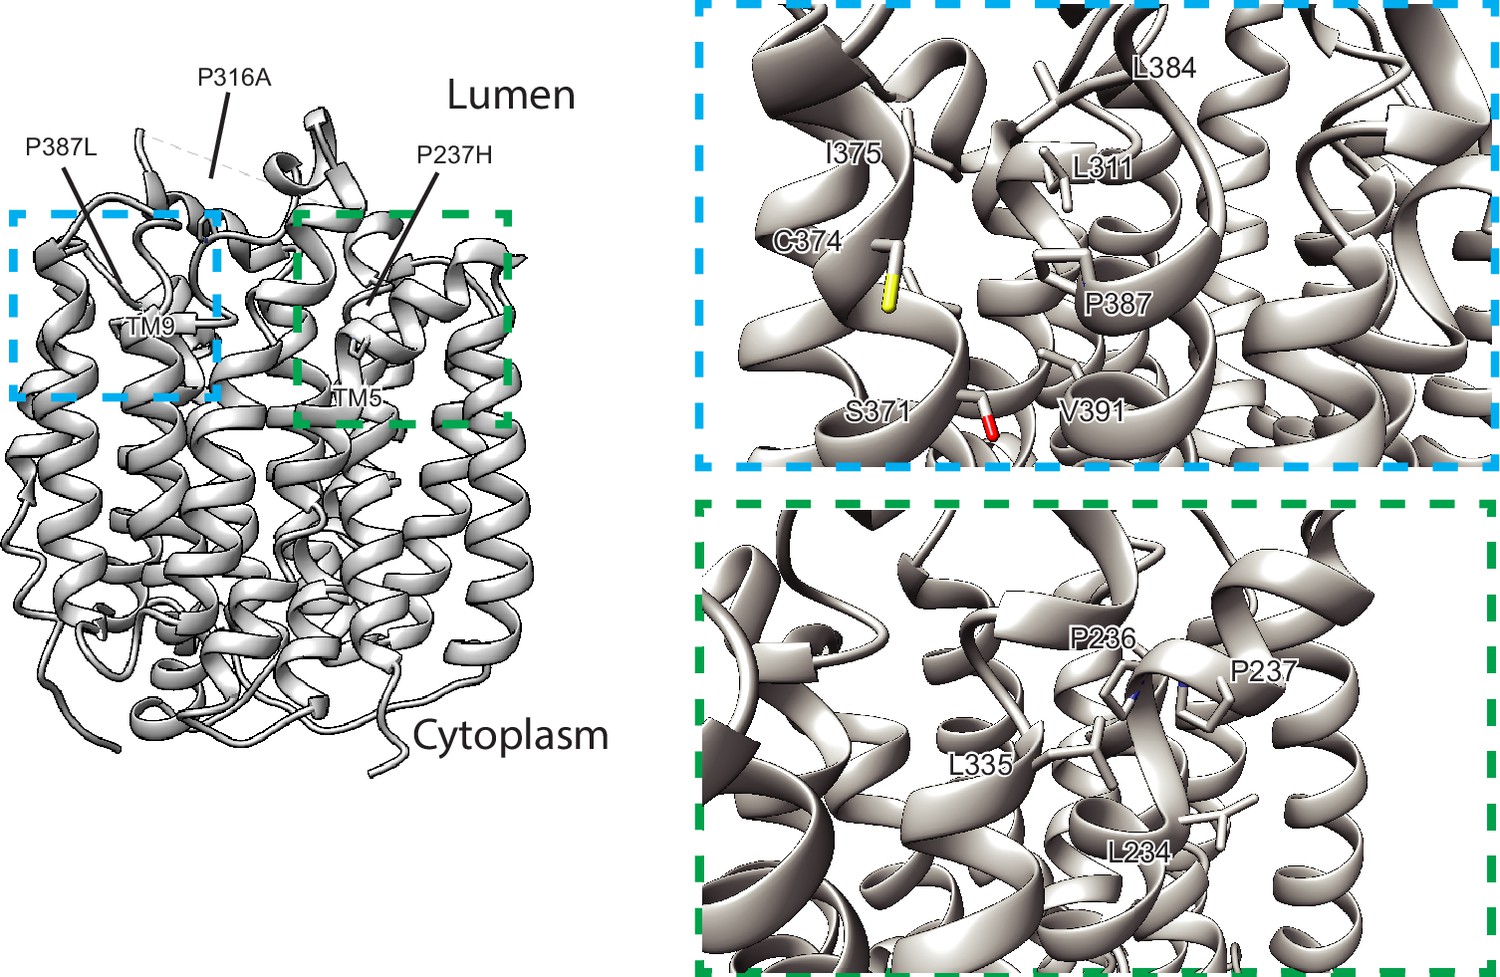
Human variants of vesicular monoamine transporter 2 (VMAT2).
P316A, P237H, and P387L localize to LL4 and the lumenal ends of TM5 and TM9, respectively.
Videos
Video 1
Same as Figure 4—videos 1–3, with neutral tetrabenazine (TBZ), but with the additional protonation of D426 (TBZ_3 run 1).(Related to Table 3).
TBZ adopted the predominant pose similar to that resolved in the cryo-electron microscopy (cryo-EM) structure.
Video 2
Molecular dynamics (MD) simulation of the binding and coordination of protonated tetrabenazine (TBZ) (TBZ+; pink van der Waals [vdW] format) to vesicular monoamine transporter 2 (VMAT2) with protonated E312 and D399.
(Related to Table 3). This is a 100 ns run, termed TBZ_2 run 1. The same format as Figure 4—videos 1–3 is adopted for the coordinating residues. TBZ tends to alter its binding pose to approximate the one observed in Figure 4—video 2.
Video 3
Same as Video 1, except for the protonation of tetrabenazine (TBZ) (TBZ+ shown in pink van der Waals [vdW] representation).
(Related to Table 3).This is a 100 ns run, termed TBZ_4 run 1. In the presence of protonation, TBZ preferentially samples the pose observed in Figure 4—video 2, Video 2.
Video 4
Fluctuations in dopamine binding pose (DA; yellow van der Waals [vdW] spheres) within its binding pocket, observed in a 100 ns molecular dynamics (MD) simulation of vesicular monoamine transporter 2 (VMAT2) in the presence of DA (system DA_2 in Table 5). Related to Table 5.
VMAT2 E312 and D399 are protonated; and D33 and D426 are deprotonated. Hydrophobic gate residues F135, W318, and F334 are displayed in purple vdW spheres, and acidic and basic residues K138 and R189 are shown in red and blue vdW representation.
Tables
Table 1
Cryo-electron microscopy (cryo-EM) data collection, refinement, and validation statistics.
| VMAT2-TBZ(EMDB-41269)(PDB 8THR) | |
|---|---|
| Data collection and processing | |
| Magnification | 77,279 |
| Voltage (kV) | 300 |
| Electron exposure (e–/Å2) | 60 |
| Defocus range (μm) | –1.0 to –2.5 |
| Pixel size (Å) | 0.647 |
| Symmetry imposed | C1 |
| Initial particle images (no.) | ~10,000,000 |
| Final particle images (no.) | 65516 |
| Map resolution (Å) FSC threshold | 3.12 0.143 |
| Map resolution range (Å)* | 6.6–2.8 |
| Refinement | |
| Initial model used (PDB code) | |
| Model resolution (Å) FSC threshold | 3.7 0.5 |
| Model resolution range (Å) | 20.4–3.7 |
| Map sharpening B-factor Å2 | |
| Model composition Non-hydrogen atoms Protein residues Ligands | 2937 389 1 |
| B-factors Å2 Protein Ligand | 28.99 55.22 |
| R.m.s. deviations Bond lengths (Å) Bond angles (°) | 0.0004 (0) 0.37 (15) |
| Validation MolProbity score Clashscore Poor rotamers (%) | 1.23 4.34 0.96 |
| Ramachandran plot Favored (%) Allowed (%) Disallowed (%) | 98.0 2.00 0.00 |
-
*
Local resolution range at 0.5 FSC.
Table 2
Calculated Kd values of dihydrotetrabenazine (DTBZ) for various single-point mutants.
| Mutant | Kd (nM) |
|---|---|
| WT | 15±3 |
| N34A | ND |
| N34D | ND |
| N34Q | ND |
| N34T | ND |
| E127A | 15±6 |
| F135A | ND |
| R189A | ND |
| V232L | ND |
| E312Q | ND |
| W318A | ND |
| W318F | 24±16 |
| W318H | ND |
| W318R | ND |
| F429A | 7.7±0.6 |
| Y433A | ND |
Table 3
Molecular dynamics (MD) simulation systems of vesicular monoamine transporter 2 (VMAT2) in the presence of tetrabenazine (TBZ), their properties and simulation durations.
| System ID | Protonated residues | Bound ligand | Duration (ns) | Waters in binding pocket* | RMSD in VMAT2 Cα-atoms (Å)† | RMSD in TBZ heavy atoms (Å) ‡ |
|---|---|---|---|---|---|---|
| TBZ_1 | E312 and D399 | TBZ | 3×180 | 2.8±1.3 | 2.4±0.3 | 2.7±0.5 |
| TBZ_2 | TBZ+ | 2×100 | 8.1±1.4 | 2.4±0.4 | 5.9±1.4 | |
| TBZ_3 | E312, D399, and D426 | TBZ | 3×100 | 4.6±1.4 | 2.7±0.5 | 3.5±1.3 |
| TBZ_4 | TBZ+ | 2×100 | 14.3±2.4 | 2.3±0.2 | 3.7±0.4 |
-
*
Number of water molecules within 3.5 Å of TBZ (or TBZ+) averaged over multiple MD snapshots.
-
†
RMSDs (root-mean-square-deviations) of VMAT2 Cα-atoms from their initial (cryo-EM resolved) positions.
-
‡
RMSD of the heavy atoms of TBZ from their cryo-EM-resolved positions. All averages and standard deviations were calculated between 50 and 100 ns portion of the MD trajectories.
Table 4
pKa calculations performed by PROPKA 3.5.0.
| Residue | pKa with TBZ | pKa without TBZ | Model pKa |
|---|---|---|---|
| D33 | 5.48 | 5.43 | 3.8 |
| D121 | 4.46 | 4.46 | 3.8 |
| D123 | 4.75 | 4.75 | 3.8 |
| D213 | 3.23 | 3.23 | 3.8 |
| D214 | 4.95 | 4.95 | 3.8 |
| D262 | 6.44 | 6.44 | 3.8 |
| D291 | 4.44 | 4.44 | 3.8 |
| D399 | 7.64 | 7.56 | 3.8 |
| D411 | 2.74 | 2.74 | 3.8 |
| D426 | 6.38 | 6.35 | 3.8 |
| D460 | 8.19 | 8.07 | 3.8 |
| E120 | 3.06 | 3.06 | 4.5 |
| E127 | 4.77 | 4.77 | 4.5 |
| E215 | 4.27 | 4.27 | 4.5 |
| E216 | 3.91 | 3.91 | 4.5 |
| E244 | 4.52 | 4.52 | 4.5 |
| E278 | 4.22 | 4.22 | 4.5 |
| E312 | 6.71 | 7.46 | 4.5 |
| E321 | 4.53 | 4.53 | 4.5 |
| K138 | 9.86 | 10.04 | 10.5 |
| R189 | 9.10 | 10.02 | 12.5 |
| TBZ | 8.57 | 10 |
-
The cryo-EM structure (with or without TBZ) was used for pKa calculations using PROPKA 3.5.0. Key residues of interest are written in boldface.
Table 5
Molecular dynamics (MD) simulations of vesicular monoamine transporter 2 (VMAT2) in the presence of dopamine and the observed events.
| System # | Protonated residues | Duration(ns) | Waters in binding pocket* | VMAT2 RMSD† fromcryo-EM (Å) | Observed events |
|---|---|---|---|---|---|
| DA_0 | None | 2×100 | 7.7±1.5 | 2.6±0.2 | Salt bridge formation between DA and D399; influx of water into the binding pocket. |
| DA_1 | D399 | 2×100 | 10.5±2.2 | 2.2±0.2 | Salt bridges formation between DA and E312; influx of water into the binding pocket. |
| DA_2 | E312, D399 | 2×100 | 8.8±2.1 | 2.2±0.3 | Fluctuations in DA binding pose while remaining within the binding pocket. Formation of two water wires. |
| DA_3 | E312, D399, D426 | 2×100 | 8.8±2.1 | 2.5±0.2 | Fluctuations in DA binding pose; dislocation of DA from its binding site in one of the two simulations. |
| DA_4 | E312, D399, D426, D33 | 1×100 1×200 | 11.7±2.3 | 2.6±0.3 | Fluctuations in DA binding pose; dislocation and release of DA in the 200 ns run. |
-
*
Number of water molecules within 3.5 Å of dopamine averaged over MD snapshots recorded in the time interval 50–100 ns.
-
†
RMSDs (root-mean-square-deviations) in VMAT2 Cα-atoms positions; all averages and standard deviations refer to the portion 50–100 ns of MD simulations.
Key resources table
| Reagent type (species) or resource | Designation | Source or reference | Identifiers | Additional information |
|---|---|---|---|---|
| Gene (Homo sapiens) | Human vesicular monoamine transporter 2 | Clone ID 40025175 | NCBI Reference Sequence: BC108928 | Horizon Discovery |
| Gene (Lama glama) | Anti-GFP nanobody | Plasmid #49172 | Addgene | |
| Cell line (Homo sapiens) | HEK293S GnTI- | ATCC | Cat # ATCC CRL-3022 | Used for expression of VMAT2 (PMID:27929454) |
| Cell line (Spodoptera frugiperda) | Sf9 | ATCC | Cat # ATCC CRL-1711 | Used in production of baculovirus for transduction (PMID:27929454) |
| Transfected construct (human) | pEG BacMam | Gouaux lab | PMID:25299155 | |
| Affinity chromatography resin | Strep-Tactin Superflow high capacity resin | IBA Lifesciences | Cat # 2-1208-500 | Affinity purification resin |
| Chemical compound, drug | n-Dodecyl-β-D-maltoside | Anatrace | Cat # D310 | Detergent |
| Chemical compound, drug | Cholesteryl hemisuccinate | Anatrace | Cat # CH210 | Lipid |
| Chemical compound, drug | Reserpine | Sigma | Cat # 83580 | Inhibitor |
| Chemical compound, drug | Dihydrotetrabenazine | Cayman Chemicals | Cat # 27182 | Inhibitor |
| Chemical compound, drug | [3H]5-HT | PerkinElmer | Cat # NET1167250UC | Radiolabeled substrate |
| Chemical compound, drug | [3H]dihydrotetrabenazine | American Radiolabeled Chemicals | Cat # ART 2119 | Radiolabeled inhibitor |
| Chemical compound, drug | Tetrabenazine | Sigma | Cat # T2952 | Inhibitor |
| Chemical compound, detergent | Digitonin | Sigma | Cat # 300410 | Detergent |
| Software, algorithm | Phenix | PMID:22505256 | RRID:SCR_014224 | https://www.phenix-online.org/ |
| Software, algorithm | SerialEM | PMID:16182563 | RRID:SCR_017293 | http://bio3d.colorado.edu/SerialEM |
| Software, algorithm | CryoSPARC | PMID:28165473 | RRID:SCR_016501 | https://cryosparc.com/ |
| Software, algorithm | RELION | PMID:23000701 | RRID:SCR_016274 | http://www2.mrc-lmb.cam.ac.uk/relion |
| Software, algorithm | UCSF-Chimera | PMID:15264254 | RRID:SCR_004097 | https://www.cgl.ucsf.edu/chimera/ |
| Software, algorithm | Coot | PMID:15572765 | RRID:SCR_014222 | https://www2.mrc-lmb.cam.ac.uk/personal/pemsley/coot |
| Software, algorithm | MolProbity | PMID:20057044 | RRID:SCR_014226 | http://molprobity.biochem.duke.edu/ |
| Other | R 2/1 200 mesh Au holey carbon grids | Electron Microscopy Sciences | Cat # Q210AR1 | Cryo-EM grids |
| Other | R 1.2/1.3 200 mesh Cu holey carbon grids | Electron Microscopy Sciences | Cat # Q2100CR1.3 | Cryo-EM grids |
| Other | Copper HIS-Tag YSI | PerkinElmer | Cat # RPNQ0096 | SPA beads |
Download links
A two-part list of links to download the article, or parts of the article, in various formats.
Downloads (link to download the article as PDF)
Open citations (links to open the citations from this article in various online reference manager services)
Cite this article (links to download the citations from this article in formats compatible with various reference manager tools)
Structural mechanisms for VMAT2 inhibition by tetrabenazine
eLife 12:RP91973.
https://doi.org/10.7554/eLife.91973.4


