Transposable elements regulate thymus development and function
- Institute for Research in Immunology and Cancer, Université de Montréal, Canada
- Department of Medicine, Université de Montréal, Canada
- Deeley Research Centre, BC Cancer, Canada
- Department of Medical Genetics, University of British Columbia, Canada
- Department of Computer Science and Operations Research, Université de Montréal, Canada
- Fred Hutchinson Cancer Center, United States
- Department of Physics, University of Washington, United States
- Department of Epigenetics and Molecular Carcinogenesis, University of Texas M.D. Anderson Cancer Center, United States
- Department of Biochemistry and Molecular Medicine, Université de Montréal, Canada
- Department of Chemistry, Université de Montréal, Canada
Figures
Figure 1 with 4 supplements
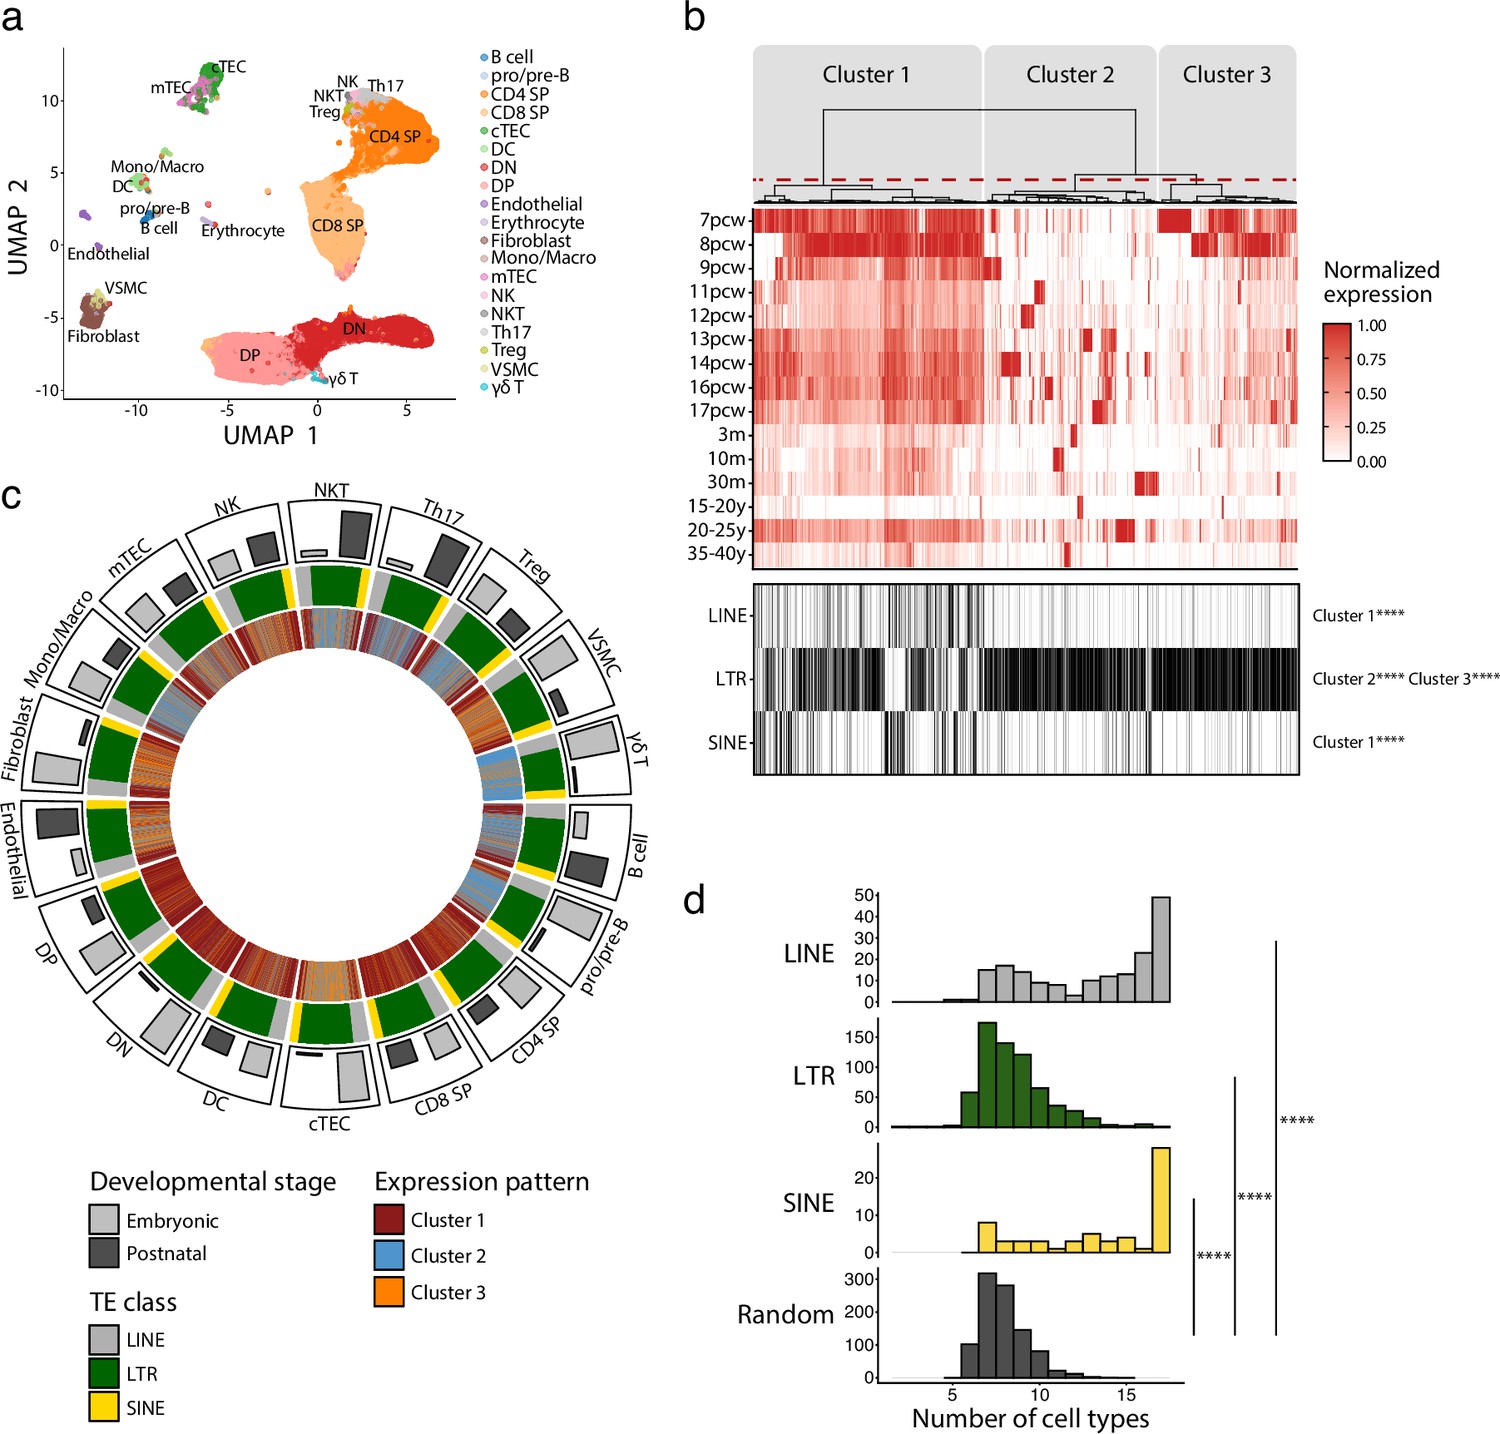
Long interspersed nuclear elements (LINE), short interspersed nuclear elements (SINE), and long terminal repeats (LTRs) exhibit distinct expression profiles in human thymic cell populations.
(a) UMAP depicting the cell populations present in human thymi (CD4 SP, CD4 single positive thymocytes; CD8 SP, CD8 single positive thymocytes; cTEC, cortical thymic epithelial cells; DC, dendritic cells; DN, double negative thymocytes; DP, double positive thymocytes; Mono/Macro, monocytes and macrophages; mTEC, medullary thymic epithelial cells; NK, natural killer cells; NKT, natural killer T cells; pro/pre-B, pro-B and pre-B cells; Th17, T helper 17 cells; Treg, regulatory T cells; VSMC, vascular smooth muscle cell). Cells were clustered in 19 populations based on the expression of marker genes from Lefkopoulos et al., 2020. (b) Upper panel: heatmap of transposable element (TE) expression during thymic development, with each column representing the expression of one TE subfamily in one cell type. Unsupervised hierarchical clustering was performed, and the dendrogram was manually cut into three clusters (red dashed line). Lower panel: the class of TE subfamilies and significant enrichments in the three clusters (Fisher’s exact tests; ****p≤0.0001). pcw, post-conception week; m, month; y, year. (c) Circos plot showing the expression pattern of TE subfamilies across thymic cells. From outermost to innermost tracks: (i) proportion of cells in embryonic and postnatal samples, (ii) class of TE subfamilies, and (iii) expression pattern of TE subfamilies identified in (b). TE subfamilies are in the same order for all cell types. (d) Histograms showing the number of cell types sharing the same expression pattern for a given TE subfamily. LINE (n = 171), LTR (n = 577), and SINE (n = 60) were compared to a randomly generated distribution (n = 809) (Kolmogorov–Smirnov tests, ****p≤0.0001).
Figure 1—figure supplement 1

Annotation of human thymic cell populations.
Dot plot depicting the expression of marker genes in the annotated cell types of the thymus. The average expression and percentage of cells expressing the gene are represented by the color and size of the dot, respectively (DN, double negative thymocytes; DP, double positive thymocytes; CD8 SP, CD8 single positive thymocytes; CD4 SP, CD4 single positive thymocytes, Treg, regulatory T cells; NKT, natural killer T cells; NK, natural killer cells; DC, dendritic cells; Mono/Macro, monocytes and macrophages; VSMC, vascular smooth muscle cells; cTEC, cortical thymic epithelial cells; mTEC, medullary thymic epithelial cells).
Figure 1—figure supplement 2
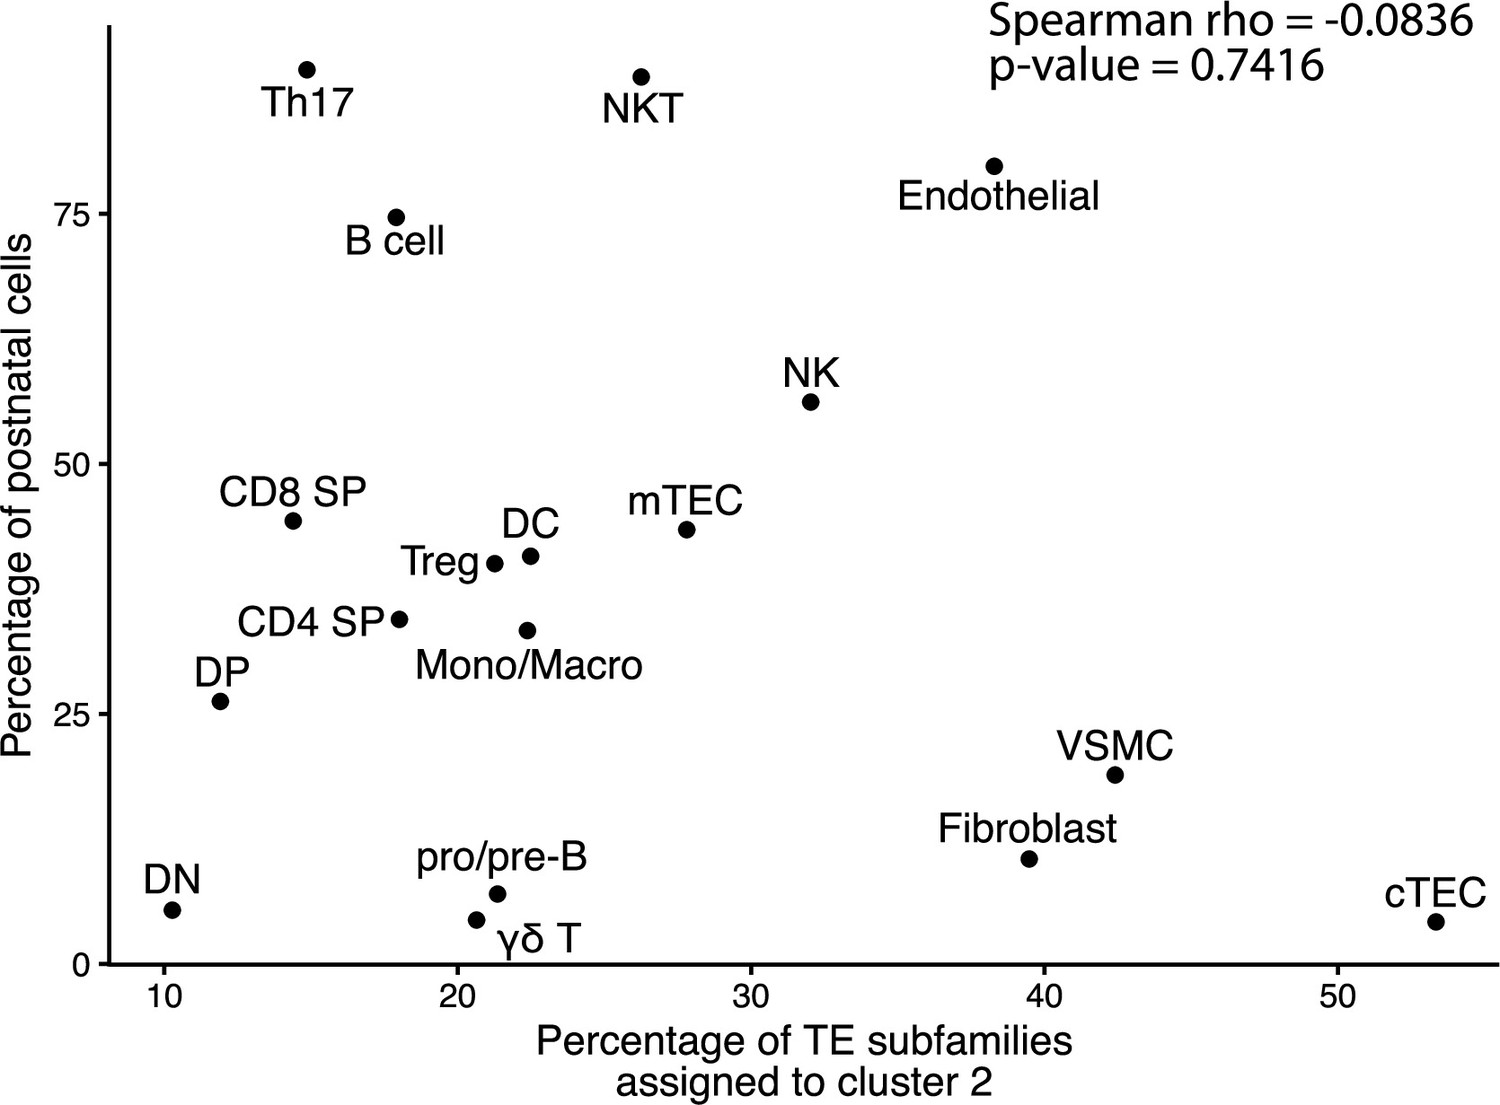
Assignment to cluster 2 is independent of the developmental stage of cells.
The graph depicts the correlation between the proportion of cells of a population originating from a postnatal sample and the proportion of transposable element (TE) subfamilies assigned to cluster 2 by the hierarchical clustering in Figure 1B.
Figure 1—figure supplement 3

Transposable element (TE) expression is negatively correlated with cell proliferation.
(a) Spearman correlation between the expression of TE subfamilies and cell cycle scores. Positively (r ≥ 0.2 and adj. p≤0.01) and negatively (r ≤ –0.2 and adj. p≤0.01) correlated subfamilies are red and blue, respectively. p-Values were corrected for multiple comparisons with the Benjamini–Hochberg method. (b) Proportion of subfamilies positively or negatively correlated with cell proliferation belonging to each TE class. (c) Percentage of overlap of TE subfamilies positively or negatively correlated with cell proliferation between cell types.
Figure 1—figure supplement 4

KRAB zinc-finger proteins (KZFP) repress transposable element (TE) expression in the hematopoietic lineage of the human thymus.
Lower panel: pairs of TE subfamilies and KZFPs significantly correlated in at least two cell types (significant correlation: r > 0.2 and adj. p≤0.05, or r < −0.2 and adj. p≤0.05, p-values corrected for multiple comparisons with the Benjamini–Hochberg method). Middle panel: enrichment of the KZFP in the sequence of the correlated TE subfamily in ChIP-seq data from Imbeault et al., 2017. Upper panel: age of TE subfamilies in millions of years (My). The dashed line indicates the estimated time of divergence between primates and rodents (82 million years ago).
Figure 2 with 3 supplements
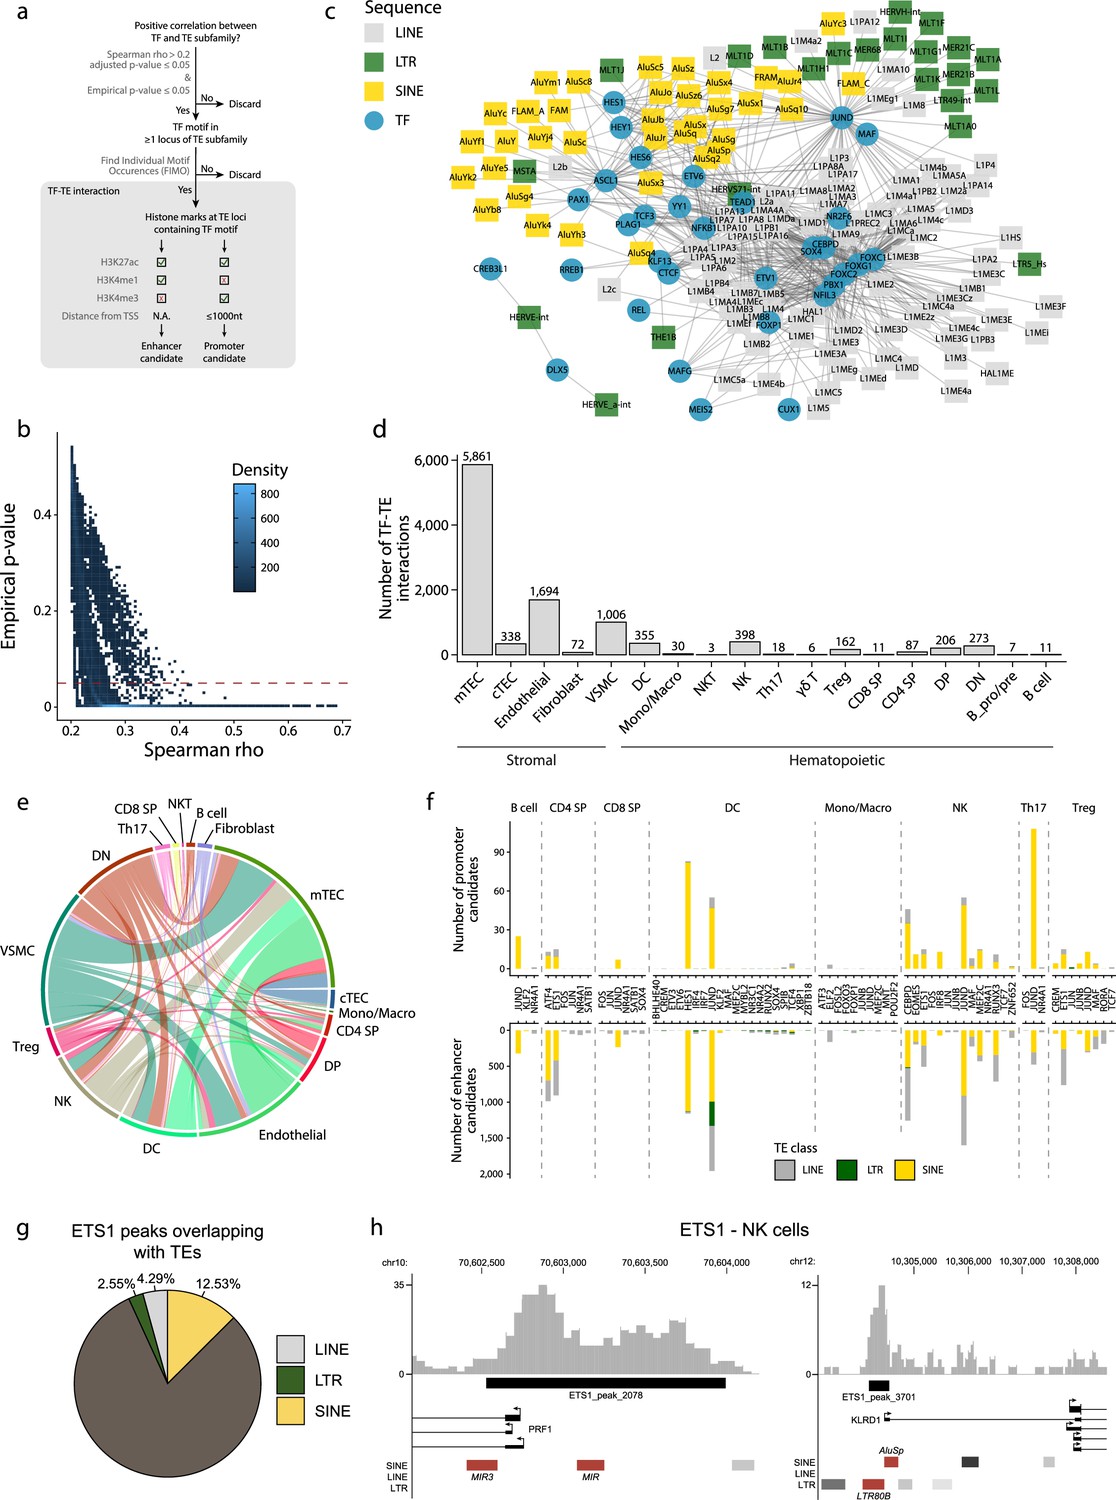
Transposable elements (TEs) shape complex gene regulatory networks in human thymic cells.
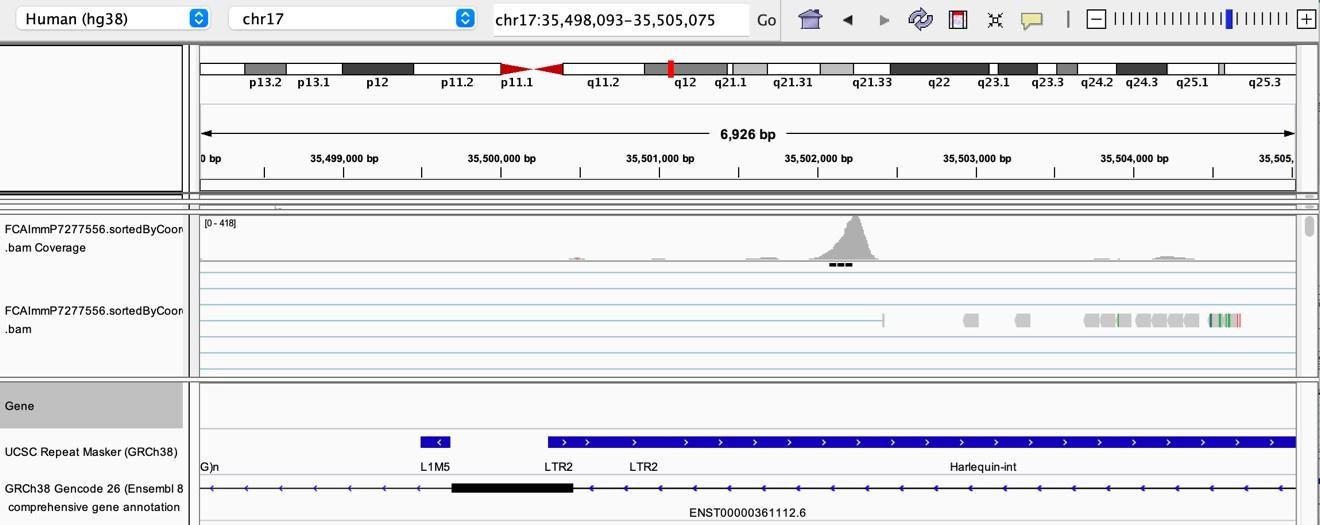
(a) The flowchart depicts the decision tree for each TE promoter or enhancer candidate. (b) Density heatmap representing the correlation coefficient and the empirical p-value determined by bootstrap for transcription factor (TF) and TE pairs in each cell type of the dataset. The color code shows density (i.e., the occurrence of TF-TE pairs at a specific point). (c) Connectivity map of interactions between TEs and TFs in medullary thymic epithelial cells (mTECs). For visualization purposes, only TF-TE pairs with high positive correlations (Spearman correlation coefficient ≥ 0.3 and p-value adjusted for multiple comparisons with the Benjamini–Hochberg procedure ≤ 0.05) and TF binding sites in ≥1% of TE loci are shown. (d) Number of TF-TE interactions for each thymic cell population. (e) Sharing of TF-TE pairs between thymic cell types. (f) Number of promoter (top) or enhancer (bottom) TE candidates per TF in hematopoietic cells of the thymus. (g) The proportion of statistically significant peaks overlapping with TE sequences in ETS1 ChIP-seq data from NK cells. (h) Genomic tracks depicting the colocalization of ETS1 occupancy (i.e., read coverage) and TE sequences (in red) in the upstream region of two genes in ETS1 ChIP-seq data from NK cells. Statistically significant ETS1 peaks are indicated by the black rectangles.
Figure 2—figure supplement 1
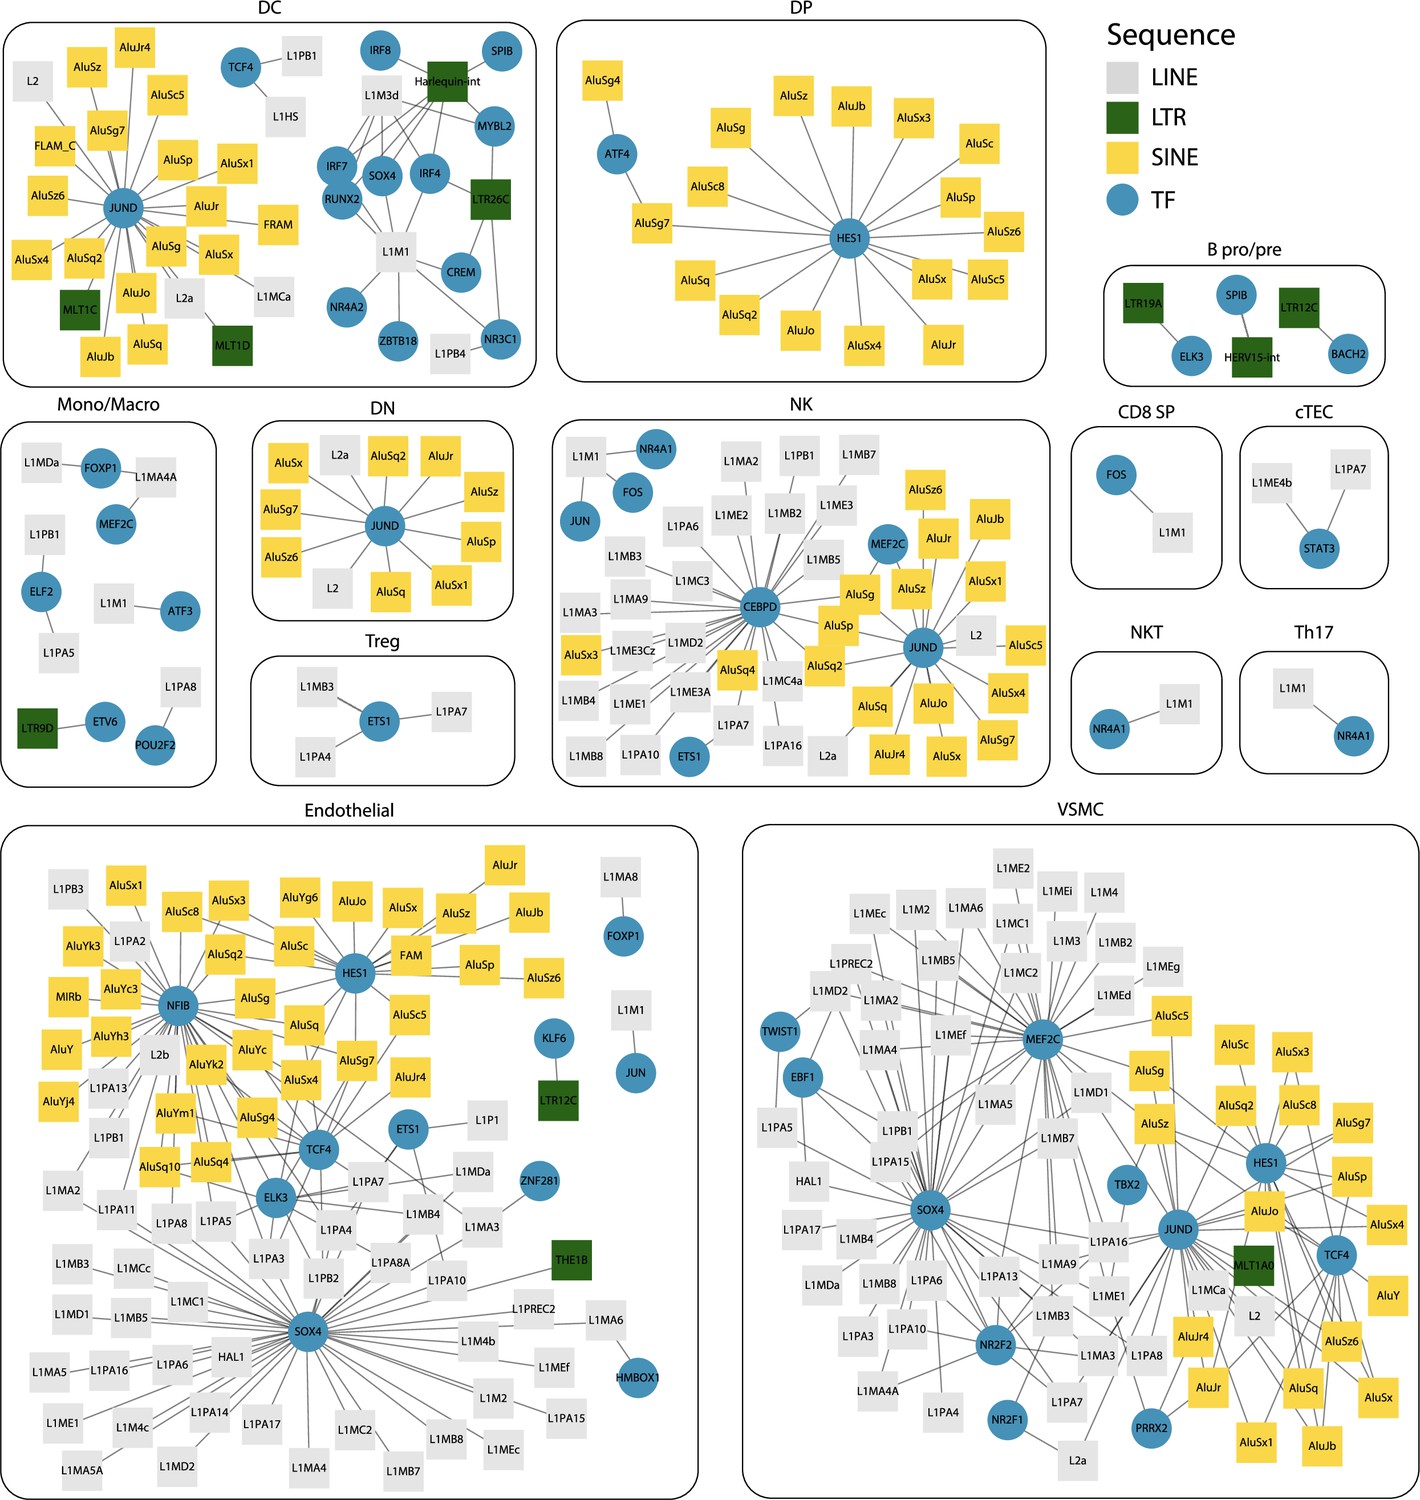
Interaction networks between transcription factors (TFs) and transposable element (TE) subfamilies.
For each cell type, networks illustrate the interactions between TF and TE subfamilies. Pairs of TF and TE are connected by edges when (i) their expressions are significantly correlated (Spearman correlation coefficient ≥ 0.2) and (ii) the TF binding motifs are found in the loci of the TE subfamily. TE subfamilies are colored based on the class of TE subfamily (long interspersed nuclear elements [LINE], long terminal repeat [LTR], and short interspersed nuclear elements [SINE]).
Figure 2—figure supplement 2
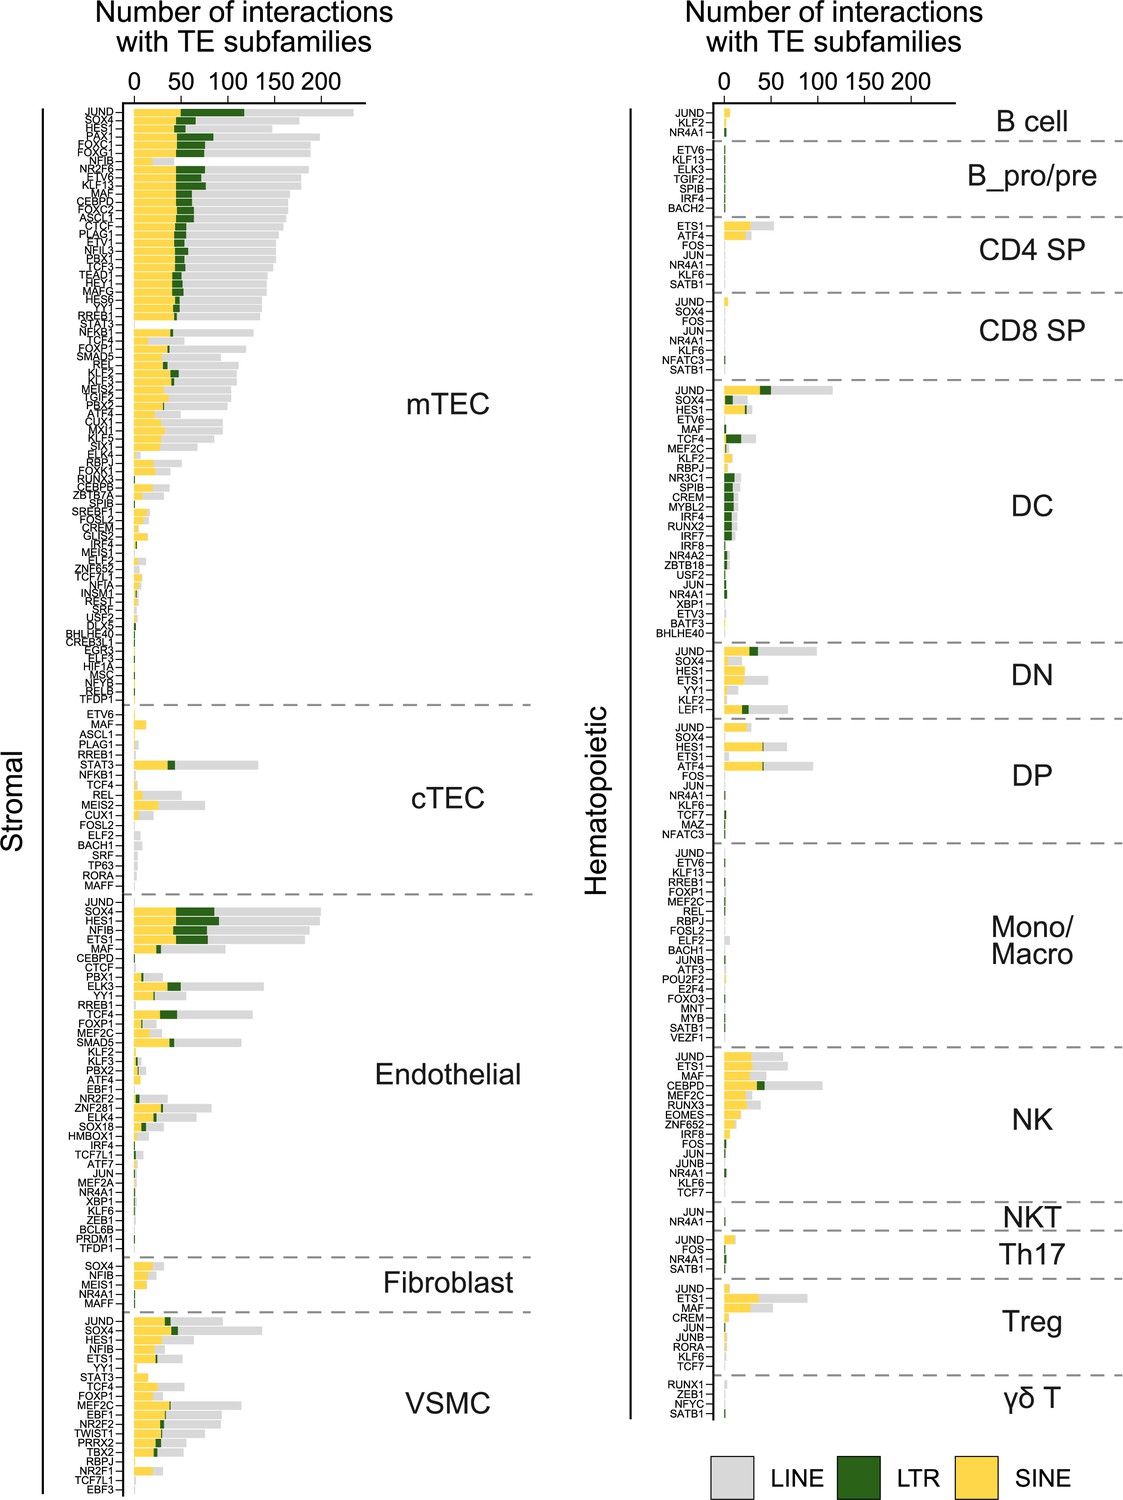
Frequency of interactions between transcription factors (TFs) and transposable element (TE) subfamilies in thymic cells.
For each cell type of the stromal (left) or hematopoietic (right) compartments of the thymus, the graph shows the number of interactions between transcription factors and TE subfamilies of the long interspersed nuclear elements (LINE), long terminal repeat (LTR), or short interspersed nuclear elements (SINE) groups.
Figure 2—figure supplement 3

Transposable element (TE) subfamilies occupying larger genomic spaces interact more frequently with transcription factor (TF).
(a) Number of interactions formed with TFs for each TE subfamily of the long interspersed nuclear elements (LINE), long terminal repeat (LTR), and short interspersed nuclear elements (SINE) classes (Wilcoxon–Mann–Whitney tests, ****p≤0.0001). (b) Scatterplot depicting the Kendall tau correlation between the number of interactions with TFs of a TE subfamily and the number of loci of that subfamily in the human genome. The color code indicates the class of TE subfamilies.
Figure 3 with 3 supplements

Human plasmacytoid dendritic cells (pDCs) and mTEC(II) express diverse and distinct repertoires of transposable element (TE) sequences.
(a) Diversity of TEs expressed by thymic populations measured by Shannon entropy. The x and y axes represent the median diversity of TEs expressed by individual cells in a population and the global diversity of TEs expressed by an entire population, respectively. The equation and blue curve represent a linear model summarizing the data. Thymic antigen-presenting cell (APC) subsets are indicated in orange. (b) Difference between the observed diversity of TEs expressed by cell populations and the one expected by the linear model in (A). (c) UMAP showing the subsets of thymic APCs (aDC, activated DC; cDC1, conventional DC1; cDC2, conventional DC2). (d) Bar plot showing the number and class of differentially expressed TE subfamilies between APC subsets. (e) Frequency of expression of TE subfamilies by the different APC subsets. The distributions for pDCs and mTEC(II) are highlighted in bold. mTEC, medullary thymic epithelial cell.
Figure 3—figure supplement 1
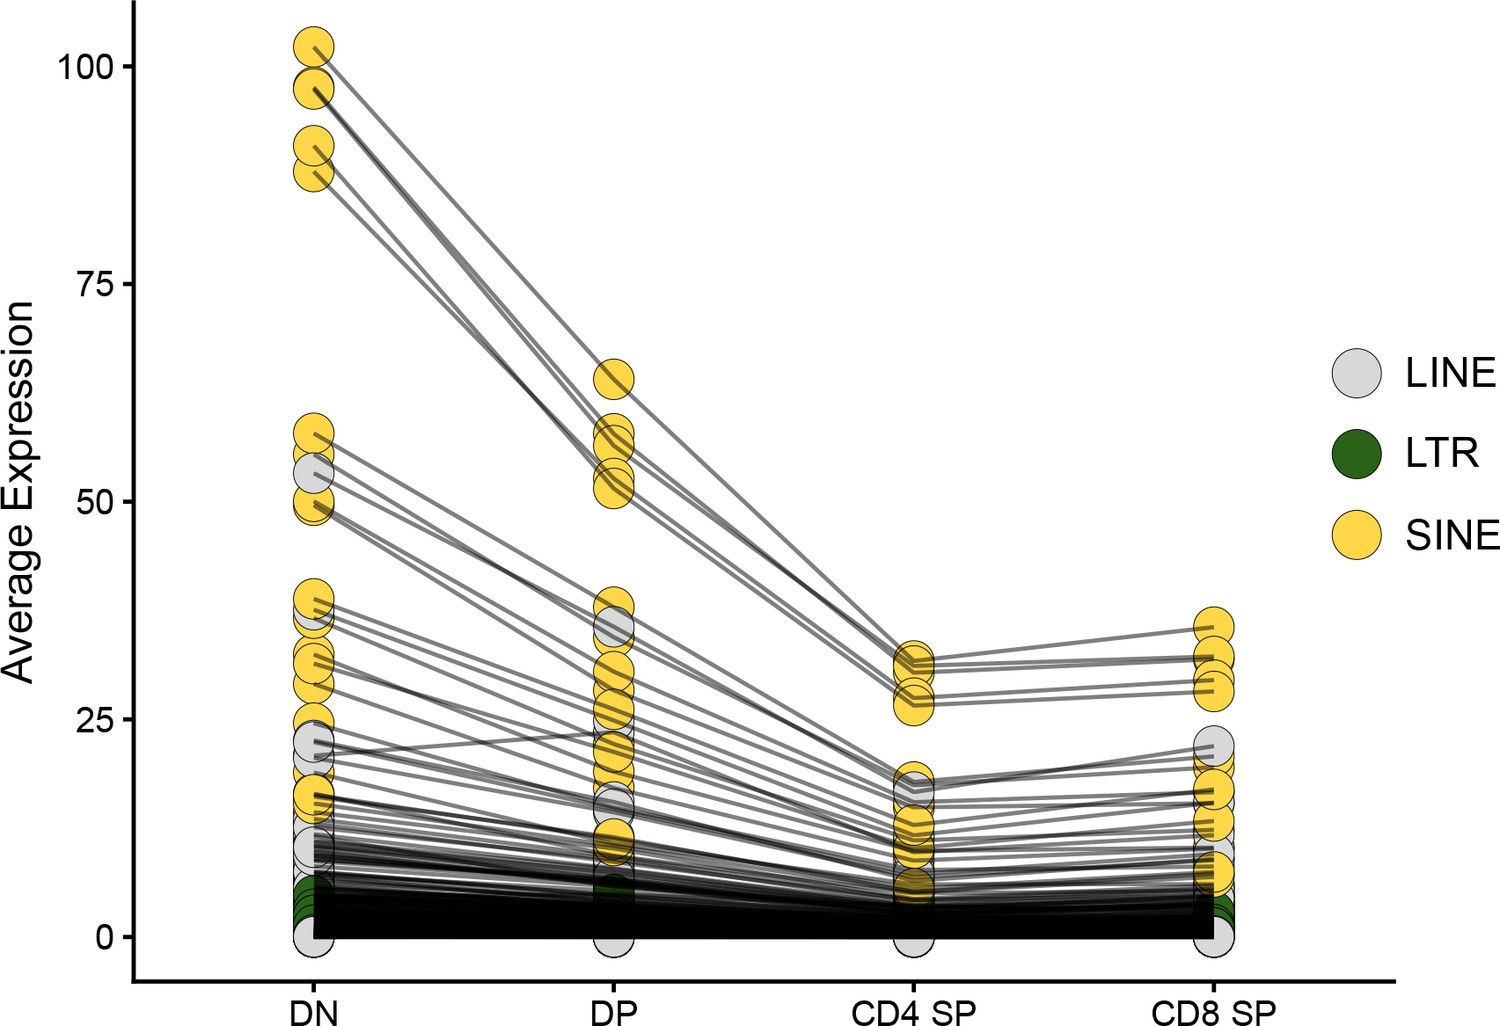
Transposable element (TE) expression decreases during thymocyte differentiation.
The average expression level of TE subfamilies across cells of the four main populations of thymocytes is shown: DN, DP, CD4 SP, and CD8 SP. Black lines between thymocyte subsets connect expression values for the same TE subfamily.
Figure 3—figure supplement 2
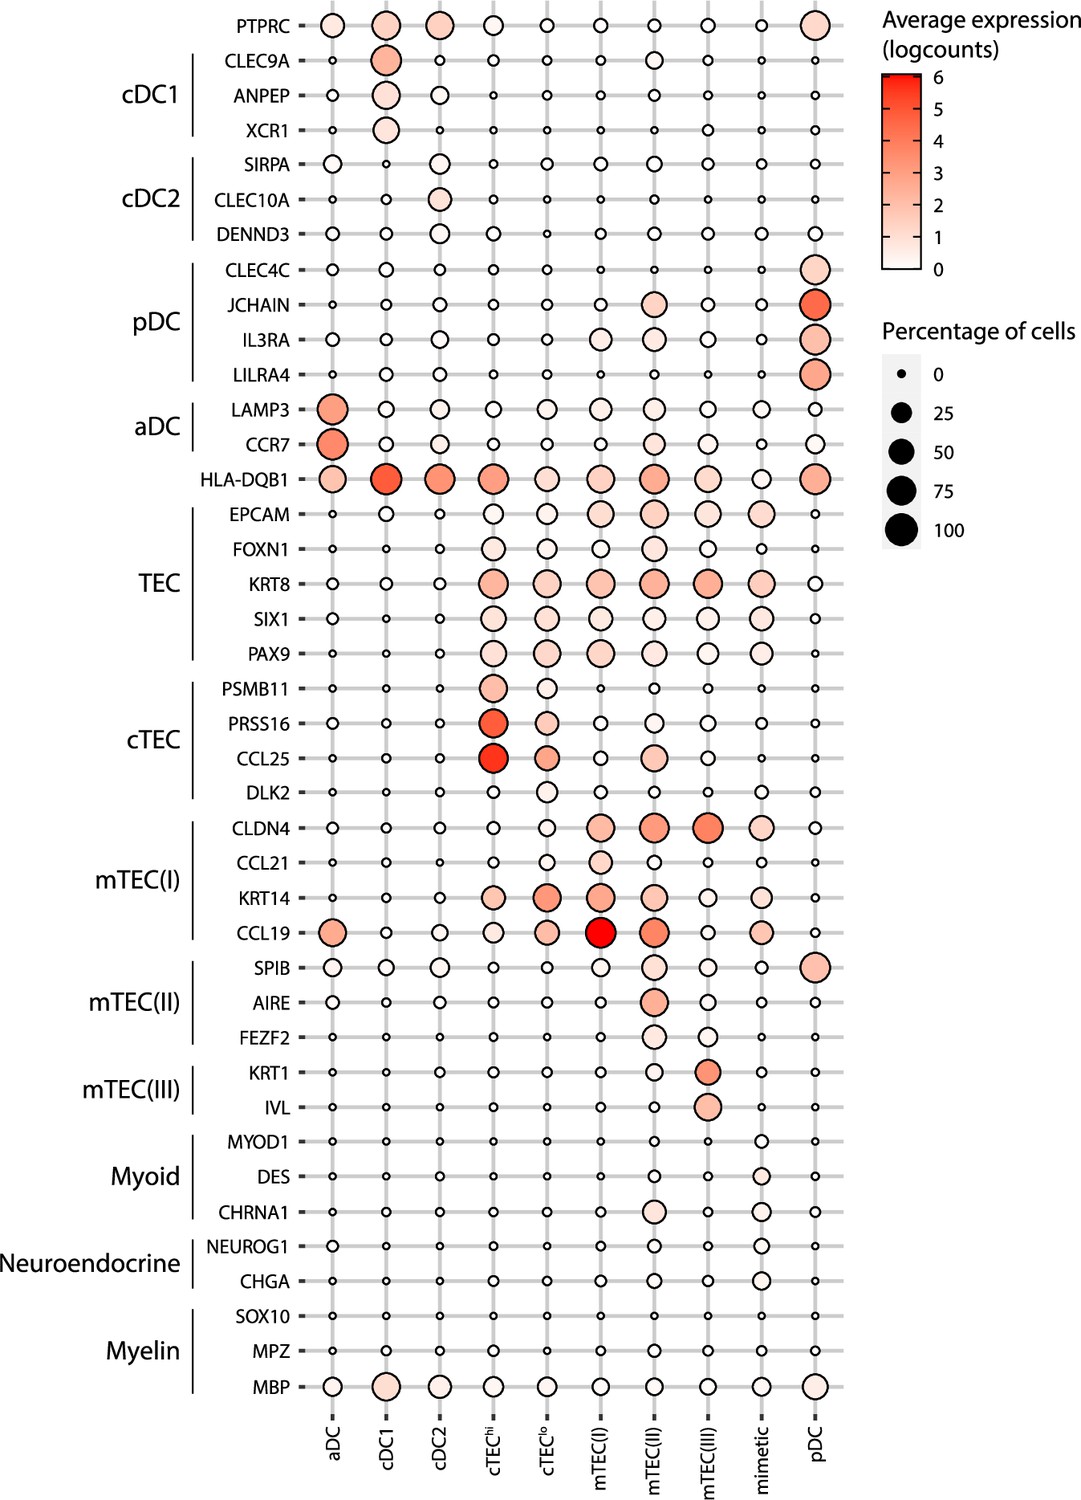
Annotation of human thymic antigen-presenting cell subsets.
Dot plot depicting the expression of marker genes in the annotated cell types of the thymus. The average expression and percentage of cells expressing the gene are represented by the color and size of the dot, respectively. Myoid-, myeloid- and neuroendocrine-related genes are used as markers of mimetic mTEC. aDC, activated dendritic cell; cDC1, conventional dendritic cell 1; cDC2, conventional dendritic cell 2; cTEC, cortical thymic epithelial cell; mTEC, medullary thymic epithelial cell; pDC, plasmacytoid dendritic cell.
Figure 3—figure supplement 3
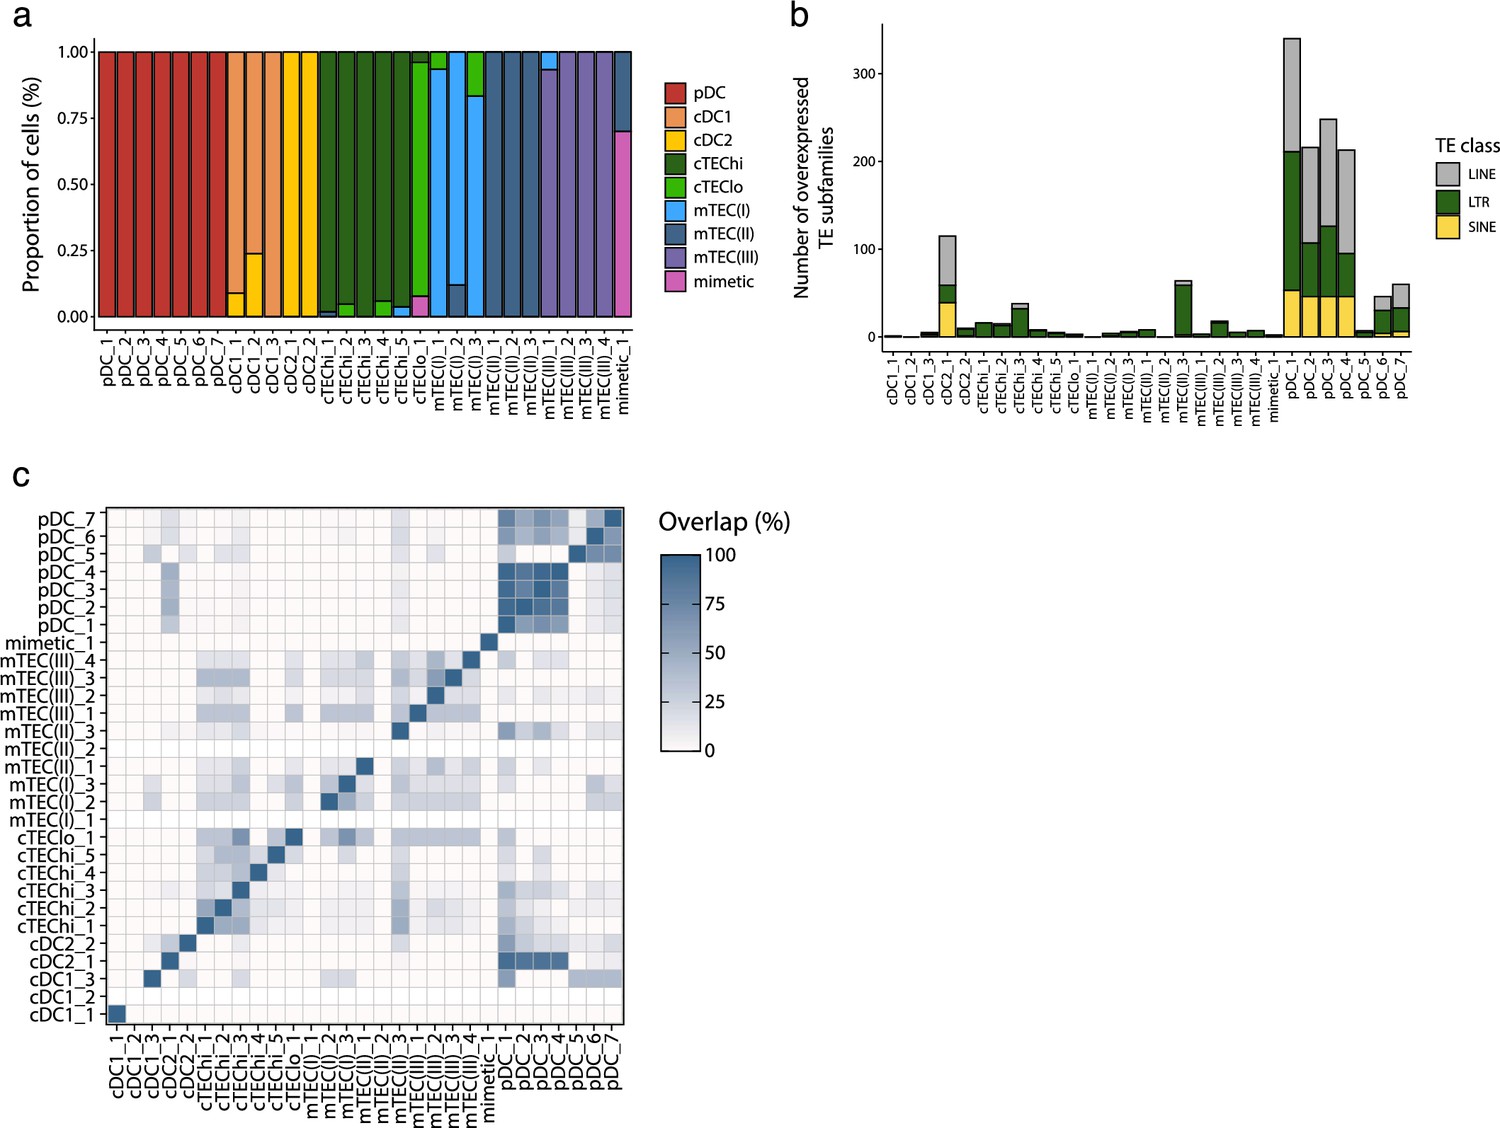
Differential transposable element (TE) expression in metacells of human thymic antigen-presenting cells.
(a) Cellular composition of the metacells (x-axis) based on the manual annotation of the thymic cell populations (see Figure 3—figure supplement 2). (b) Number of TE subfamilies overexpressed expressed between the metacells. TE subfamilies are colored based on class (long interspersed nuclear elements [LINE], long terminal repeat [LTR], and short interspersed nuclear elements [SINE]). (c) Percentage of overlap of the TE subfamilies overexpressed by each metacell.
Figure 4 with 2 supplements

Transposable element (TE) expression in human plasmacytoid dendritic cells (pDCs) is associated with dsRNA formation and type I IFN signaling.
(a) Frequency of long interspersed nuclear elements (LINE), long terminal repeat (LTR), and short interspersed nuclear elements (SINE) subfamilies expression in thymic pDCs. (b) Differential expression of TE subfamilies between splenic and thymic pDCs. TE subfamilies significantly upregulated or downregulated by thymic pDCs are indicated in red and blue, respectively (Upregulated, log2(Thymus/Spleen) ≥ 1 and adj. p≤0.05; Downregulated, log2(Thymus/Spleen) ≤ –1 and adj. p≤0.05). (c, d) Immunostaining of dsRNAs in human thymic pDCs (CD123+) using the J2 antibody (n = 3). (c) One representative experiment. Three examples of CD123 and J2 colocalization are shown with white arrows. (d) J2 staining intensity in CD123+ and CD123- cells from three human thymi (Wilcoxon rank-sum test, ****p-value≤0.0001). (e) UpSet plot showing gene sets enriched in pDCs compared to the other populations of thymic antigen-presenting cells (APCs). On the lower panel, black dots represent cell populations for which gene signatures are significantly depleted compared to pDCs. All comparisons where gene signatures were significantly enriched in pDCs are shown.
Figure 4—figure supplement 1
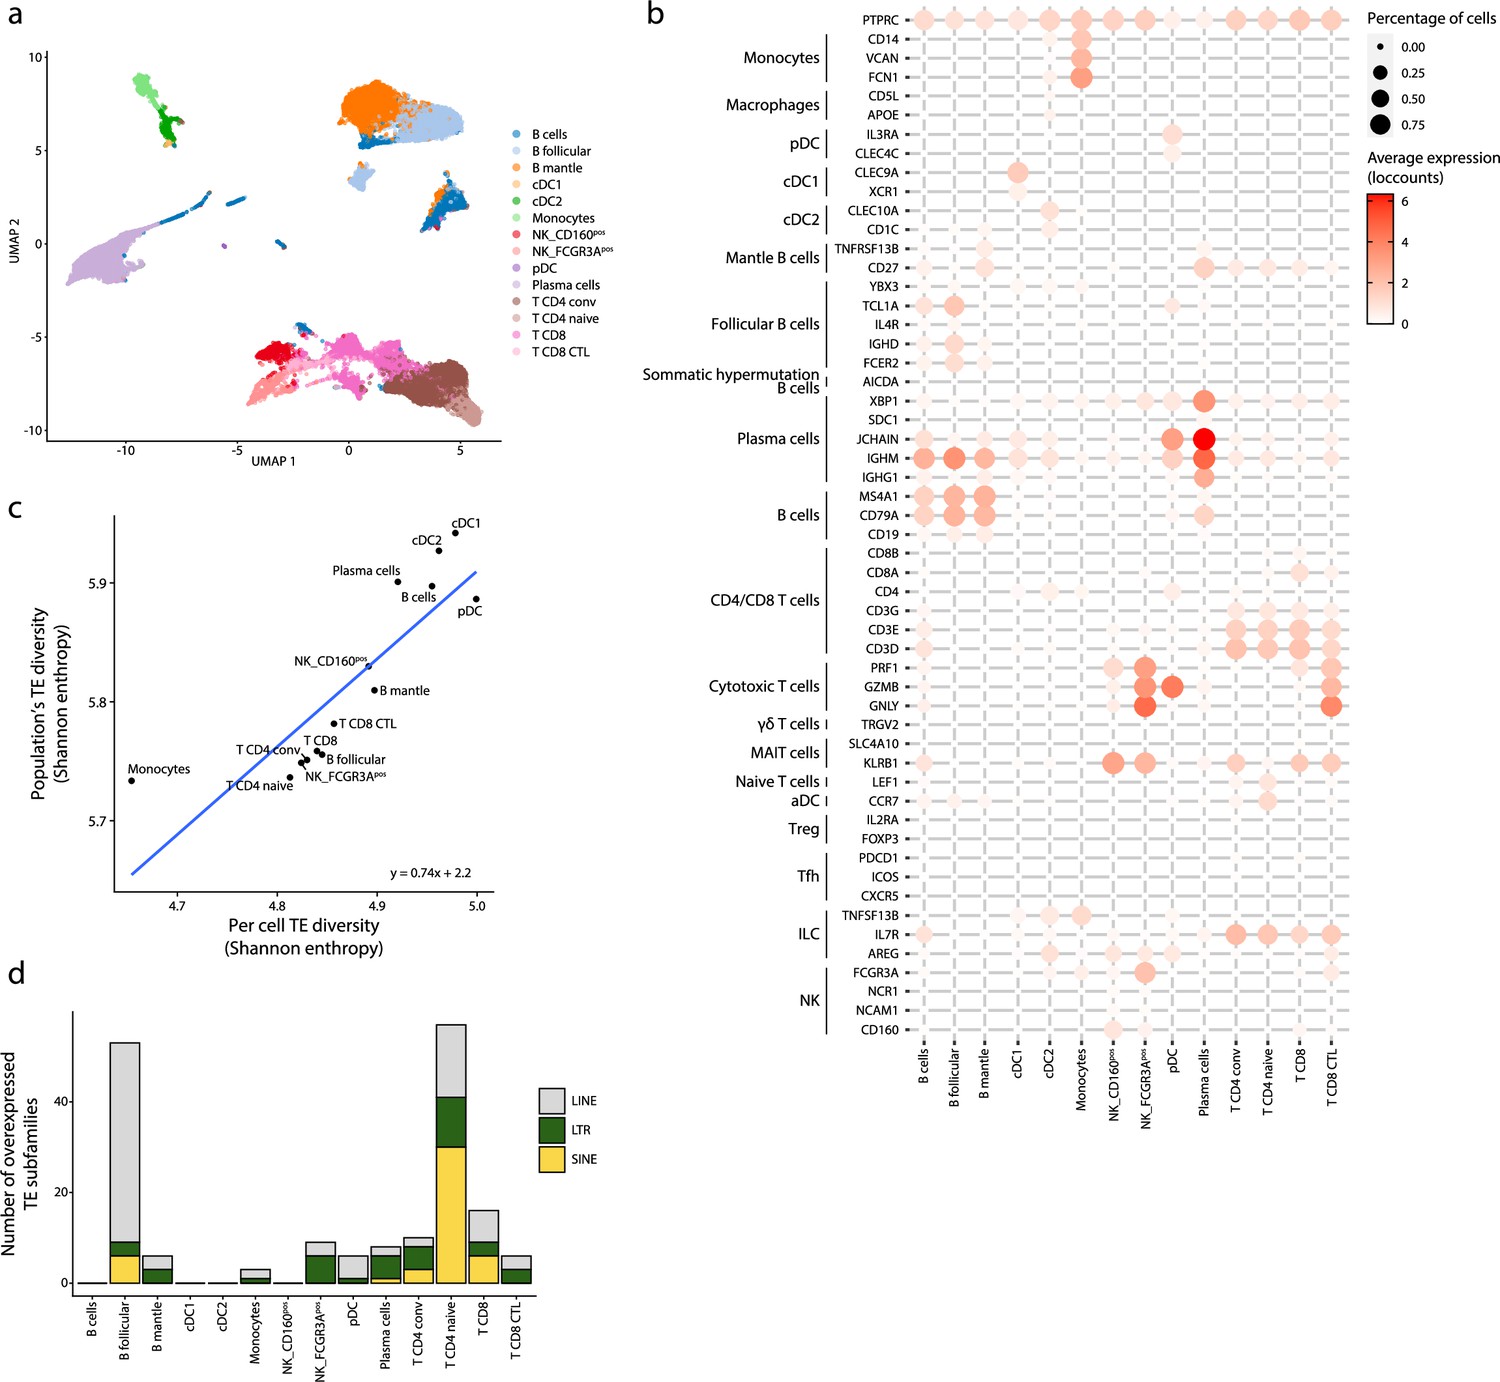
Transposable element (TE) expression in human splenic plasmacytoid dendritic cells (pDCs).
(a) UMAP depicting the cell populations present in the human spleen. (b) Dot plot showing the expression of marker genes in the annotated cell types of the spleen. The average expression and percentage of cells expressing the gene are represented by the color and size of the dot, respectively. (c) Diversity of TE expressed by splenic populations measured by Shannon entropy. The x and y axes represent the median diversity of TE expressed by individual cells of a population and the global diversity of TE expressed by discrete populations, respectively. The equation and blue curve represent a linear model summarizing the data. (d) Bar plot showing the number (y-axis) and class (color) of differentially expressed TE subfamilies between splenic cell populations.
Figure 4—figure supplement 2
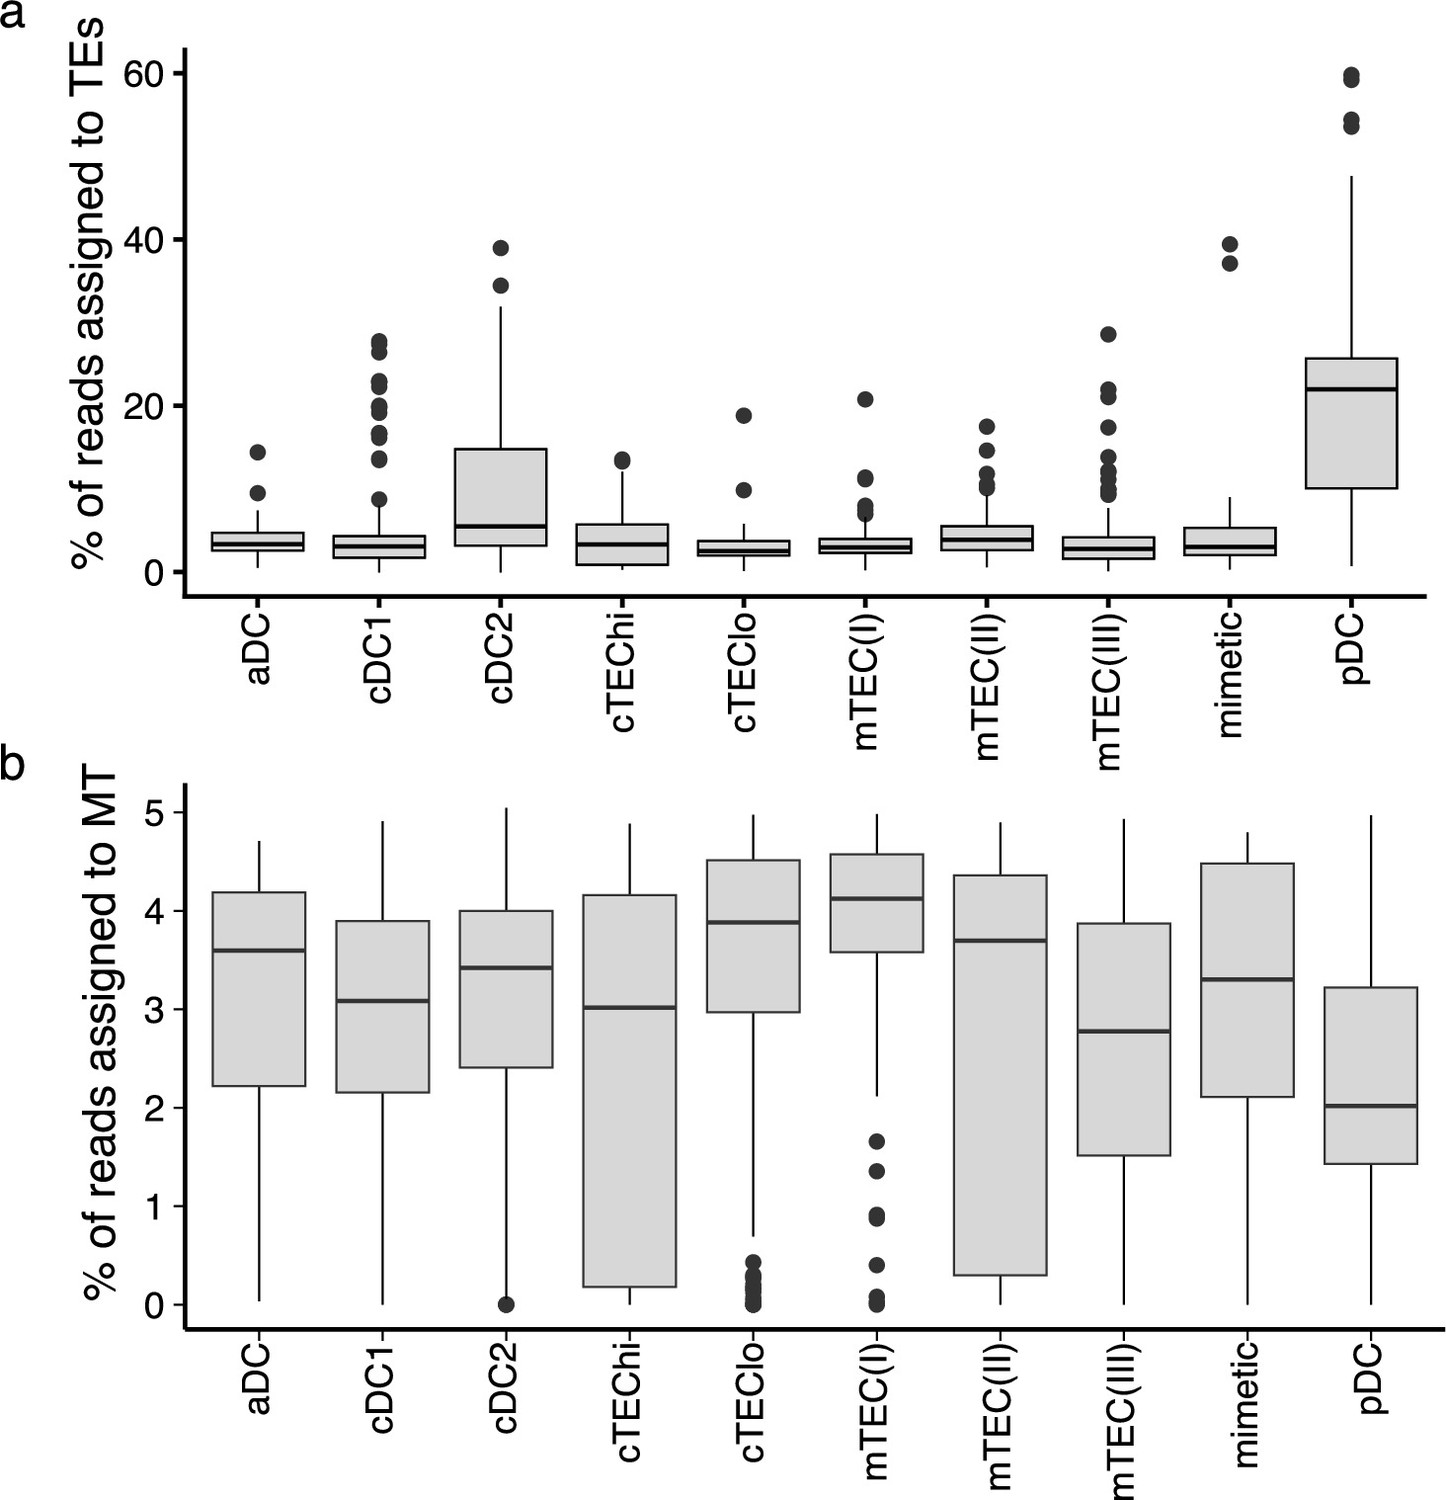
A higher proportion of reads originates from transposable elements (TEs) in plasmacytoid dendritic cells (pDCs) than in other thymic antigen-presenting cells (APCs).
Boxplots depicting the percentage of reads assigned to (a) TE sequences or (b) mitochondrial reads in the different subpopulations of thymic APCs.
Figure 5 with 1 supplement
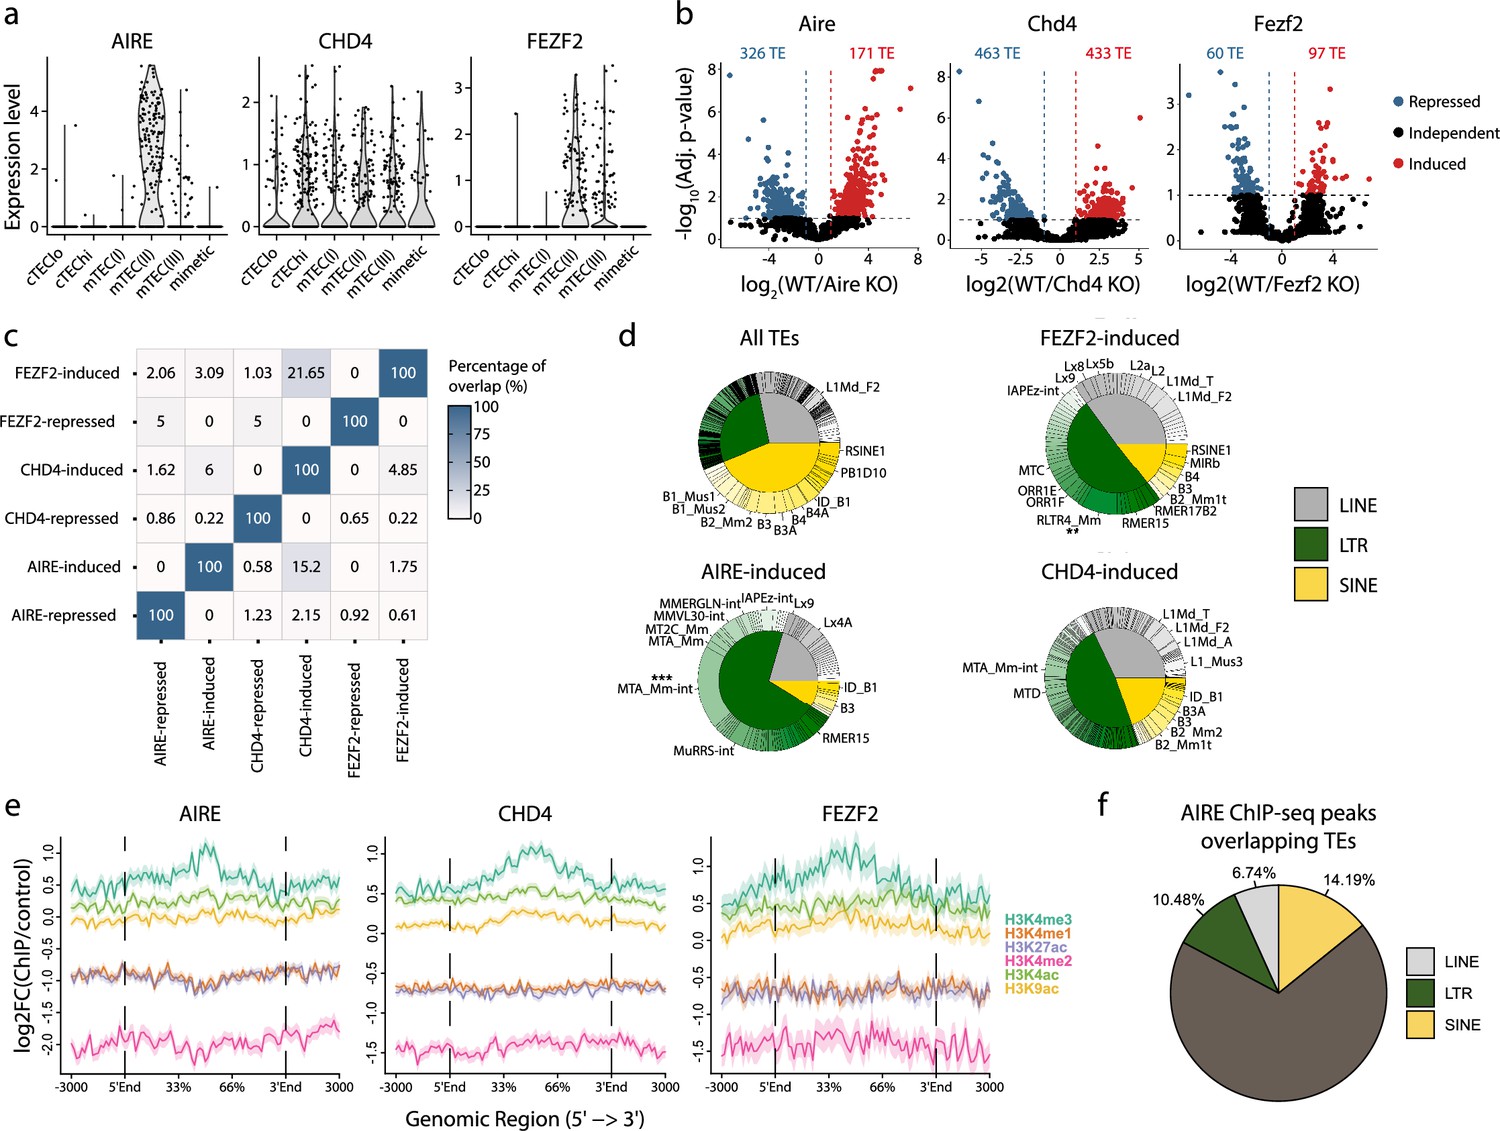
AIRE, FEZF2, and CHD4 regulate non-redundant sets of transposable elements (TEs) in murine medullary thymic epithelial cells (mTECs).
(a) Expression of AIRE, CHD4, and FEZF2 in human TEC subsets. (b) Differential expression of TE loci between wild-type (WT) and Aire-, Chd4-, or Fezf2-knockout (KO) mice (Induced, log2(WT/KO) ≥ 2 and adj. p≤0.05; Repressed, log2(WT/KO) ≤ –2 and adj. p≤0.05). p-Values were corrected for multiple comparisons with the Benjamini–Hochberg procedure. The numbers of induced (red) and repressed (blue) TE loci are indicated on the volcano plots. (c) Overlap of TE loci repressed or induced by AIRE, FEZF2, and CHD4. (d) Proportion of TE classes and subfamilies in the TE loci regulated by AIRE, FEZF2, or CHD4, as well as all TE loci in the murine genome for comparison (chi-squared tests with Bonferroni correction, **adj. p≤0.01, ***adj. p≤0.001). (e) Plots for the tag density of H3K4me3 and H3K4me2 on the sequence and flanking regions (3000 base pairs) of TE loci induced by AIRE, FEZF2, and CHD4. (f) Proportion of statistically significant peaks overlapping TE sequences in AIRE ChIP-seq data from murine mTECs.
Figure 5—figure supplement 1

Characterization of transposable element (TE) subfamilies regulated by AIRE, CHD4, and FEZF2 in murine medullary thymic epithelial cells (mTECs).
(a) Class of TEs induced or repressed by AIRE, CHD4, and FEZF2. Distributions were compared to the proportion of long interspersed nuclear elements (LINE), long terminal repeat (LTR), and short interspersed nuclear elements (SINE) amongst all TE sequences of the murine genome with chi-squared tests (**p≤0.01, ***p≤0.001). (b) Age of TEs induced, repressed, or independent of AIRE, CHD4, and FEZF2 (Wilcoxon–Mann–Whitney test, *p≤0.05, ***p≤0.001) (My, millions of years). (c) Distance between TE loci induced by AIRE, FEZF2, and CHD4, and random selections of TE loci (Wilcoxon rank-sum tests, ***p≤0.001). (d) Genomic localization of the TE loci induced or repressed by AIRE, CHD4, and FEZF2. (e) Intron retention ratio of intronic TE induced or independent of AIRE, CHD4, and FEZF2. The dashed line represents intron retention events occurring in at least 10% of transcripts.
Figure 6

Murine cortical thymic epithelial cells (cTEC) and medullary thymic epithelial cell (mTEC) present transposable element (TE) MAPs.
(a) mTECs and cTECs were isolated from the thymi of K5D1 mice (n = 2). The peptide-MHC I complexes were immunoprecipitated independently for both populations, and MAPs were sequenced by MS analyses. (b) Number of long interspersed nuclear elements (LINE)-, long terminal repeat (LTR)-, and short interspersed nuclear elements (SINE)-derived MAPs in mTECs and cTECs from K5D1 mice. (c) Distributions of TE subfamilies in murine TECs subsets based on expression level (x-axis) and frequency of expression (y-axis).
Author response image 1

Author response image 2

Author response image 3

Author response image 4

Author response image 5

Author response image 6
Author response image 7

Additional files
-
Supplementary file 1
Numerical data for TE expression in thymic development and function.
(a) Expression of TE subfamilies throughout thymus development. (b) Correlation between TE expression and cell proliferation scores. (c) Correlation between KZFP and TE subfamily expression. (d) Interactions between TE and transcription factors. (e) ENCODE dataset – samples characteristics. (f) Characteristics of TE promoter and enhancer candidates. (g) Differential expression of TE between APC subsets. (h) Gene signatures enriched in pDC relative to other APC subsets. (i) Murine TE loci regulated by Aire, Chd4, and Fezf2. (j) Characteristics of the identified TE-derived MAP.
- https://cdn.elifesciences.org/articles/91037/elife-91037-supp1-v1.xlsx
-
MDAR checklist
- https://cdn.elifesciences.org/articles/91037/elife-91037-mdarchecklist1-v1.docx
Download links
A two-part list of links to download the article, or parts of the article, in various formats.
Downloads (link to download the article as PDF)
Open citations (links to open the citations from this article in various online reference manager services)
Cite this article (links to download the citations from this article in formats compatible with various reference manager tools)
Transposable elements regulate thymus development and function
eLife 12:RP91037.
https://doi.org/10.7554/eLife.91037.3


