Heat stress impairs centromere structure and segregation of meiotic chromosomes in Arabidopsis
- CEITEC Masaryk University, Czech Republic
- Leibniz Institute of Plant Genetics and Crop Plant Research (IPK) Gatersleben, Germany
Figures
Figure 1 with 1 supplement
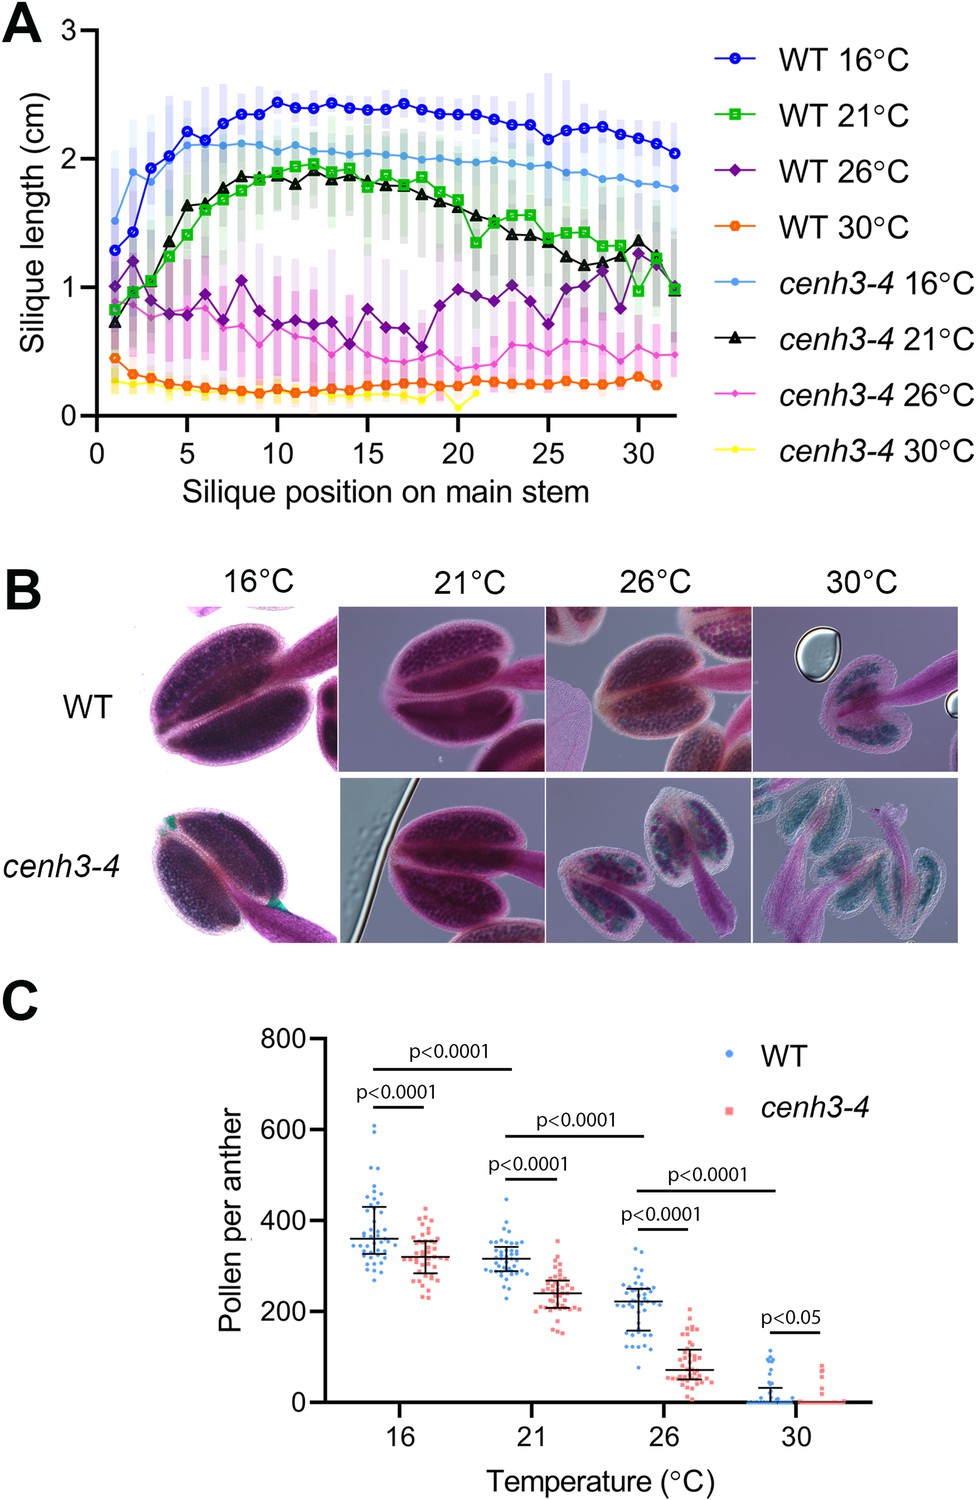
Effect of temperature on fertility in wild type and cenh3-4 plants.
(A) Analysis of silique length through the main stem of wild type (WT) grown at 16°C (n=18), 21°C (n=25), 26°C (n=13), 30°C (n=20) and cenh3-4 mutant at 16°C (n=22), 21°C (n=20), 26°C (n=22), and 30°C (n=11). The silique position is numbered from the oldest to the youngest silique on the main stem. Error bars depict standard deviation. (B) Anthers of the abovementioned plants after Alexander staining. (C) Quantification of viable pollen per anther (n=45). Significance of the difference is counted using two-tailed t-test. Source values for (A) and (C) are available in Source data 1.
Figure 1—figure supplement 1
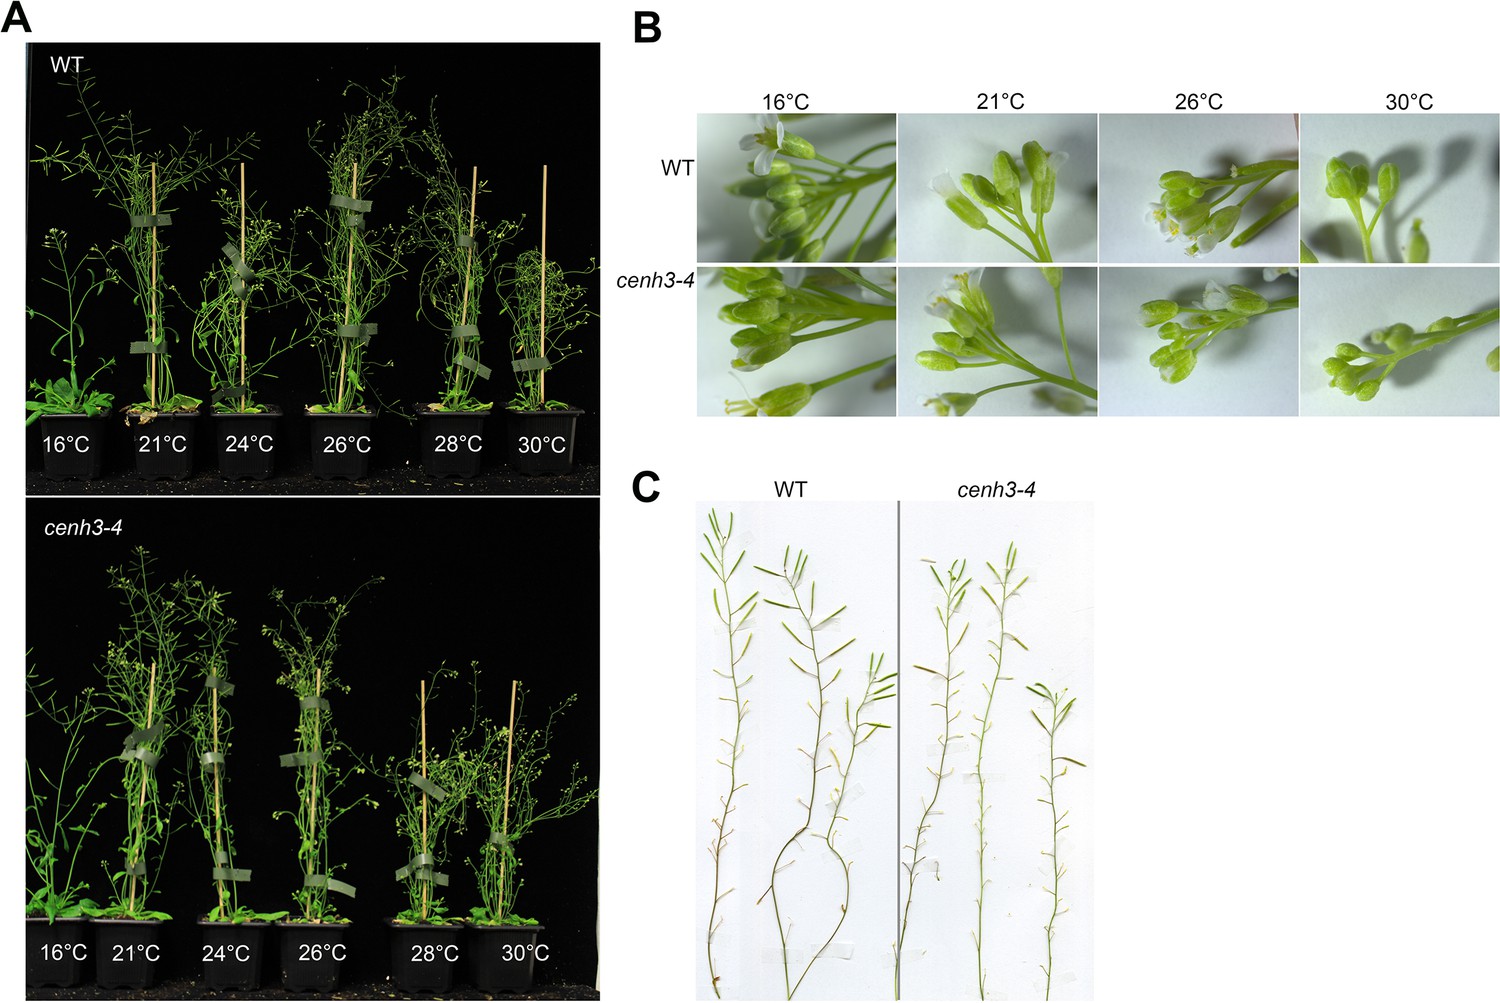
Effect of temperature on growth of wild type and cenh3-4 plants.
(A) Approximately 6-week-old wild type (WT) and cenh3-4 plants grown at 16°C, 21°C, 24°C, 26°C, 28°C, and 30°C. (B) Effect of temperature on WT and cenh3-4 inflorescence morphology. (C) Restoration of fertility in heat-induced sterile WT and cenh3-4 plants; plants were grown at 30°C for 3 weeks and then transferred to 21°C for 2 more weeks.
Figure 2 with 2 supplements
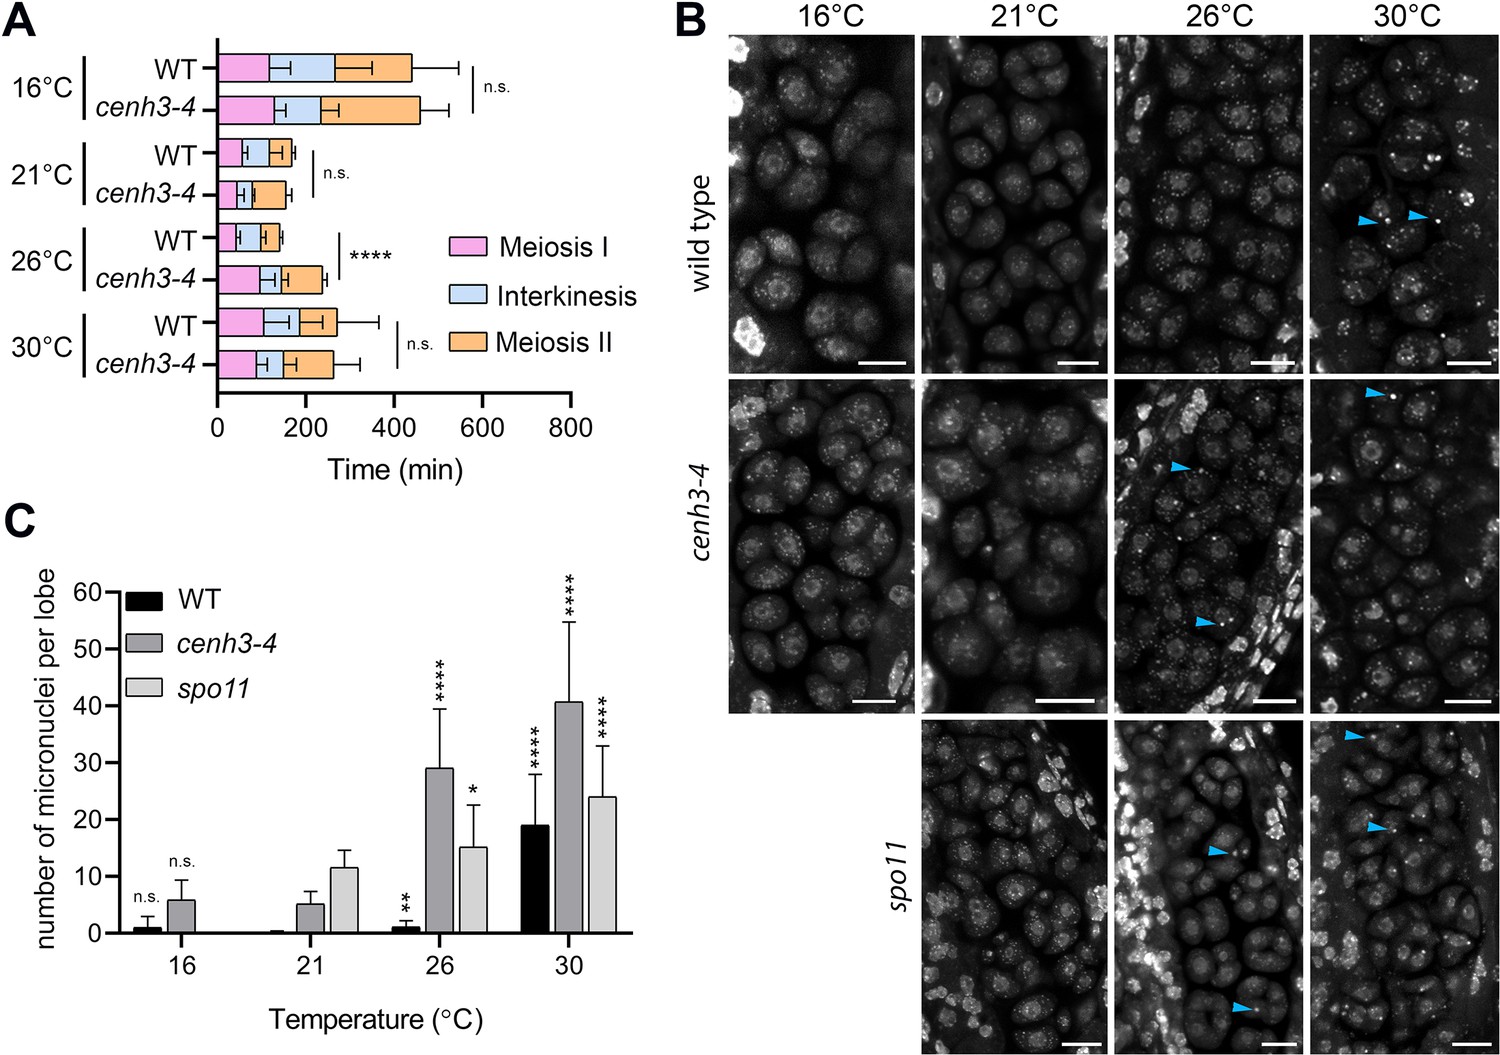
Effect of temperature on meiosis duration and micronuclei formation.
(A) Graphical representation of the duration of meiosis I (from the end of diakinesis to the end of anaphase I; Figure 2—figure supplement 1), interkinesis, and meiosis II (prometaphase II to telophase II) calculated from live imaging of anthers in wild type (WT) and cenh3-4 plants grown at 16°C, 21°C, 26°C, and 30°C. Error bars represent standard deviation (from 16°C to 30°C: in wild type n=36, 36, 36, 45 and cenh3-4 n=35, 24, 24, 4, resp.) Significance of the difference is indicated (two-tailed t-test; ****p<0.0001). (B) Anther loculi in the tetrad stage of wild type, cenh3-4 and spo11-2-3 plants grown at 16°C, 21°C, 26°C, and 30°C. DNA was stained with DAPI. Blue arrowheads indicate examples of produced micronuclei. Scale bar = 10 µm. (C) Number of micronuclei per lobe in wild type (WT, n=19, 19, 19, 19), cenh3-4 (n=19, 19, 19, 19), and spo11-2-3 (n=19, 26, 21) plants. Error bars represent standard deviation. Significance of the difference from plants of the corresponding genotype grown at 21°C is indicated (two-tailed t-test; *p<0.05, **p<0.01, ***p<0.001, ****p<0.0001). Source values for (A) and (C) are available in Source data 1.
Figure 2—figure supplement 1
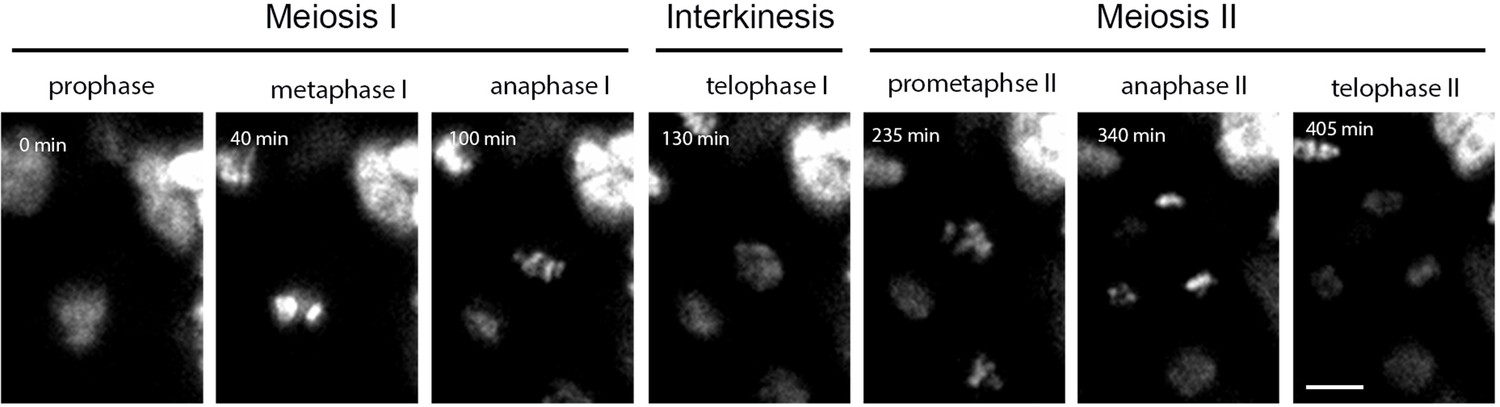
An example of a time lapse series of HTA10:RFP meiocytes indicating the meiotic stages used for calculating the duration of meiosis.
Scale bar = 5 µm.
Figure 2—figure supplement 2
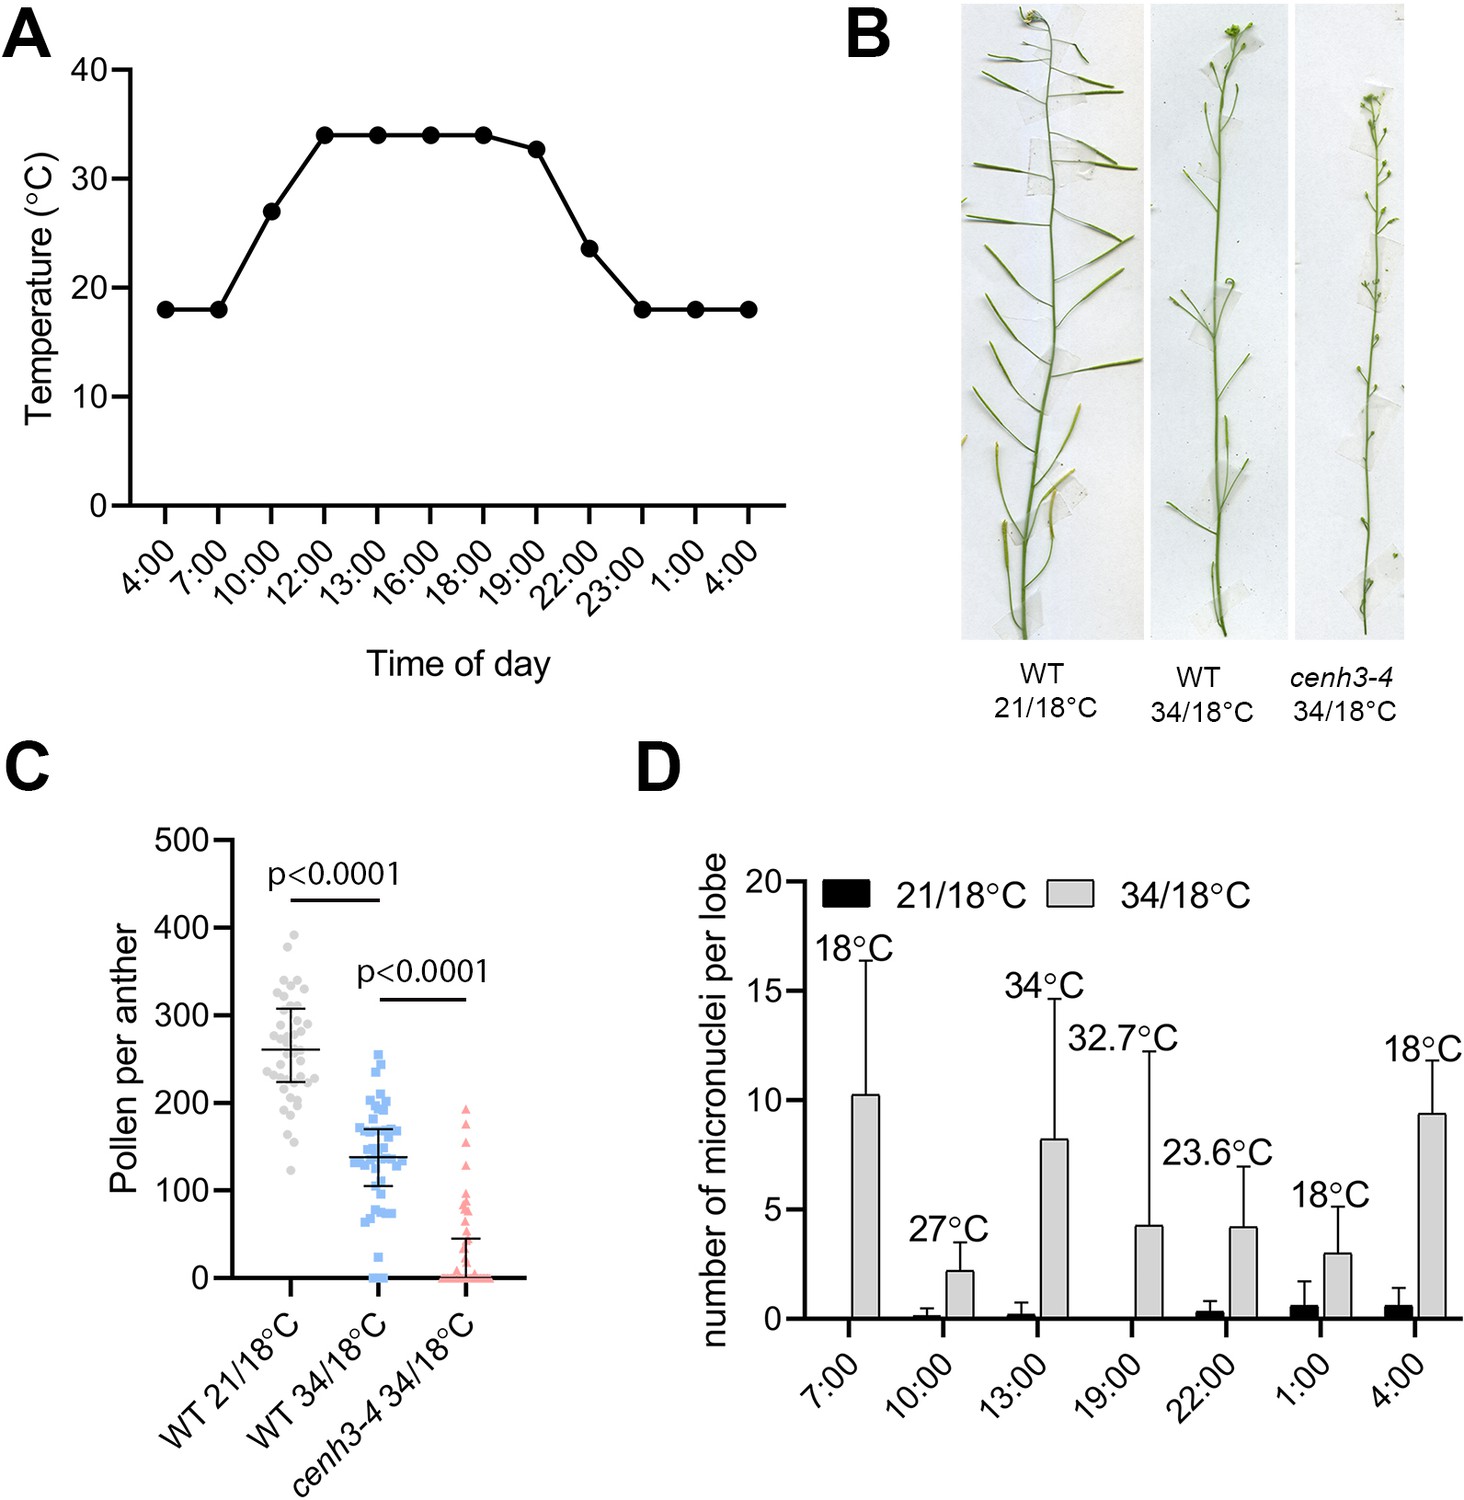
Effect of changing night-day temperatures on wild type and cenh3-4 plants.
(A) Temperature distribution in the growth chamber during a 34°C day/18°C night regime. (B) Effect of 21°C/18°C and 34°C/18°C; day/night, temperature regimes on wild type (WT) and cenh3-4 fertility. (C) Number of viable pollen in wild type at 21°C/18°C (n=44), at 34°C/18°C (n=47) and cenh3-4 mutant at 34°C/18°C (n=47). (D) Number of produced micronuclei per lobe in wild type anthers of plants grown at 21°C/18°C or 34°C/18°C. Material was collected at different time points during the day. n=10–13. Error bars depict standard deviation. Source values for (C) and (D) are available in Source data 1.
Figure 3 with 3 supplements
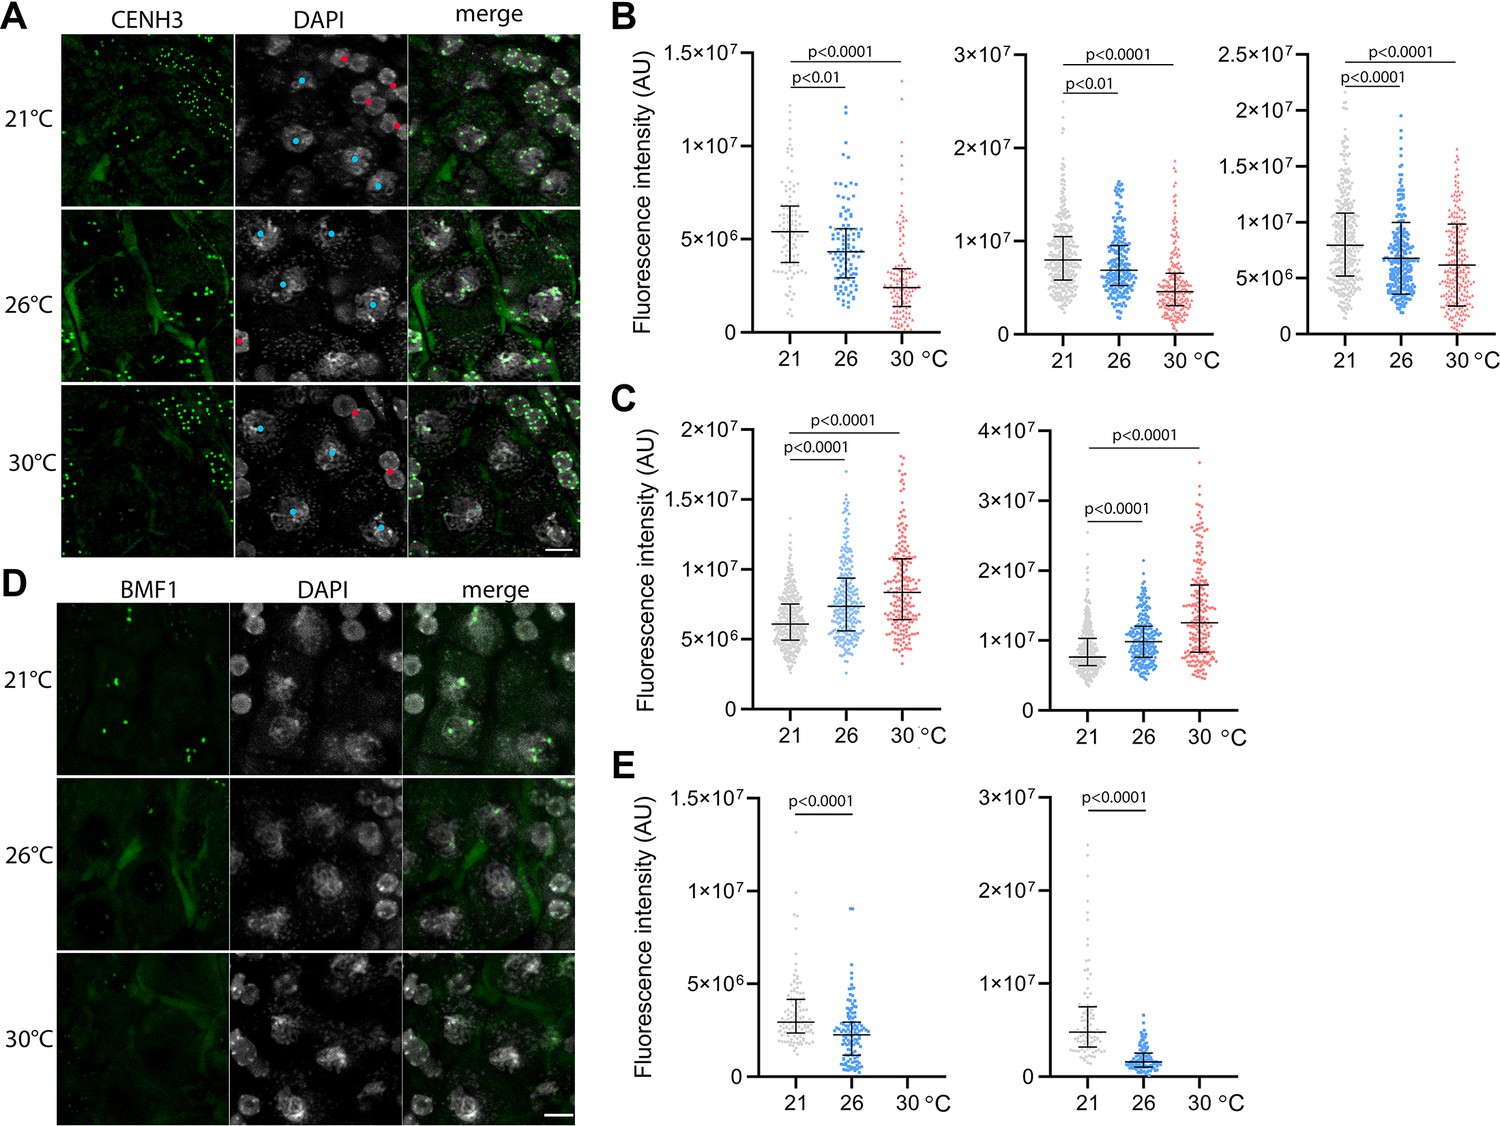
Effect of high temperature on centromere structure in wild type plants.
(A) eYFP:CENH3 expression and DAPI staining of meiotic pachytene (blue dots) and mitotic tapetal cells (red dots) in wild type plants grown at 21°C, 26°C, and 30°C. Scale bar = 5 µm. (B) Quantification of CENH3 fluorescence intensity per centromere in pachytene. Each interleaved scatter plot with median and interquartile range shows results of an independent experiment (left graph n=102, 103, 125, middle n=359, 220, 233 and right graph n=386, 268, 233). (C) Quantification of eYFP:CENH3 signal intensity in tapetum cells of plants grown at 21°C, 26°C, and 30°C. Each graph represents an independent experiment (left graph n=369, 262, 203 and right graph n=358, 266, 213). (D) Expression of BMF1:eYFP in pachytene in plants grown at 21°C, 26°C, and 30°C. DNA is counterstained with DAPI. Scale bar = 5 µm. (E) Quantification of BMF1:eYFP signal intensity per centromere in pachytene in two independent experiments; left graph n=120 and right n=100. Two-tailed t-test is used to depict the significance of the difference. Source values for (B, C, and E) are available in Source data 1.
Figure 3—figure supplement 1

Immunodetection of CENH3 on meiotic chromosomes.
(A) Immunolocalization of CENH3 (red) on pachytene chromosomes stained by DAPI (gray) in pollen mother cells from wild type flowers exposed to 21°C and 30°C. Scale bar = 2 µm. (B) Quantification of the CENH3 signal intensity per pachytene centromere in plants grown at 21°C (n=49) and 30°C (n=50). Significance of the difference assessed by the two-tailed t-test is indicated. Source values are available in Source data 1.
Figure 3—figure supplement 2
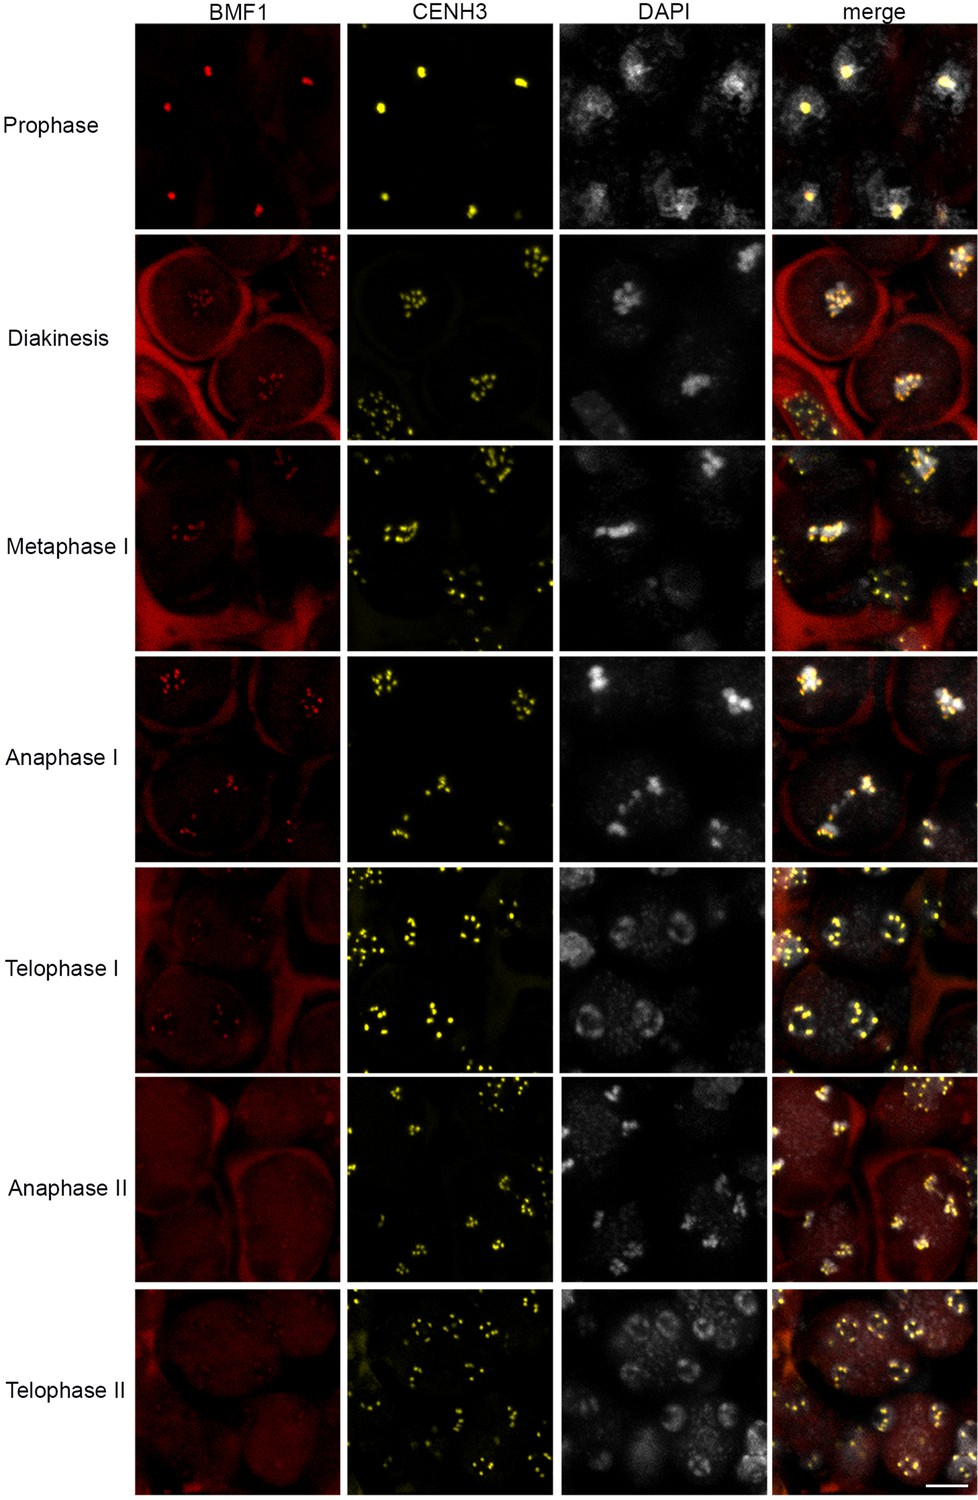
Co-localization of the kinetochore BMF1:TagRFP (red) and centromeric eYFP:CENH3 (yellow) proteins through meiosis in DAPI stained (gray) meiocytes.
Scale bar = 5 µm.
Figure 3—figure supplement 3
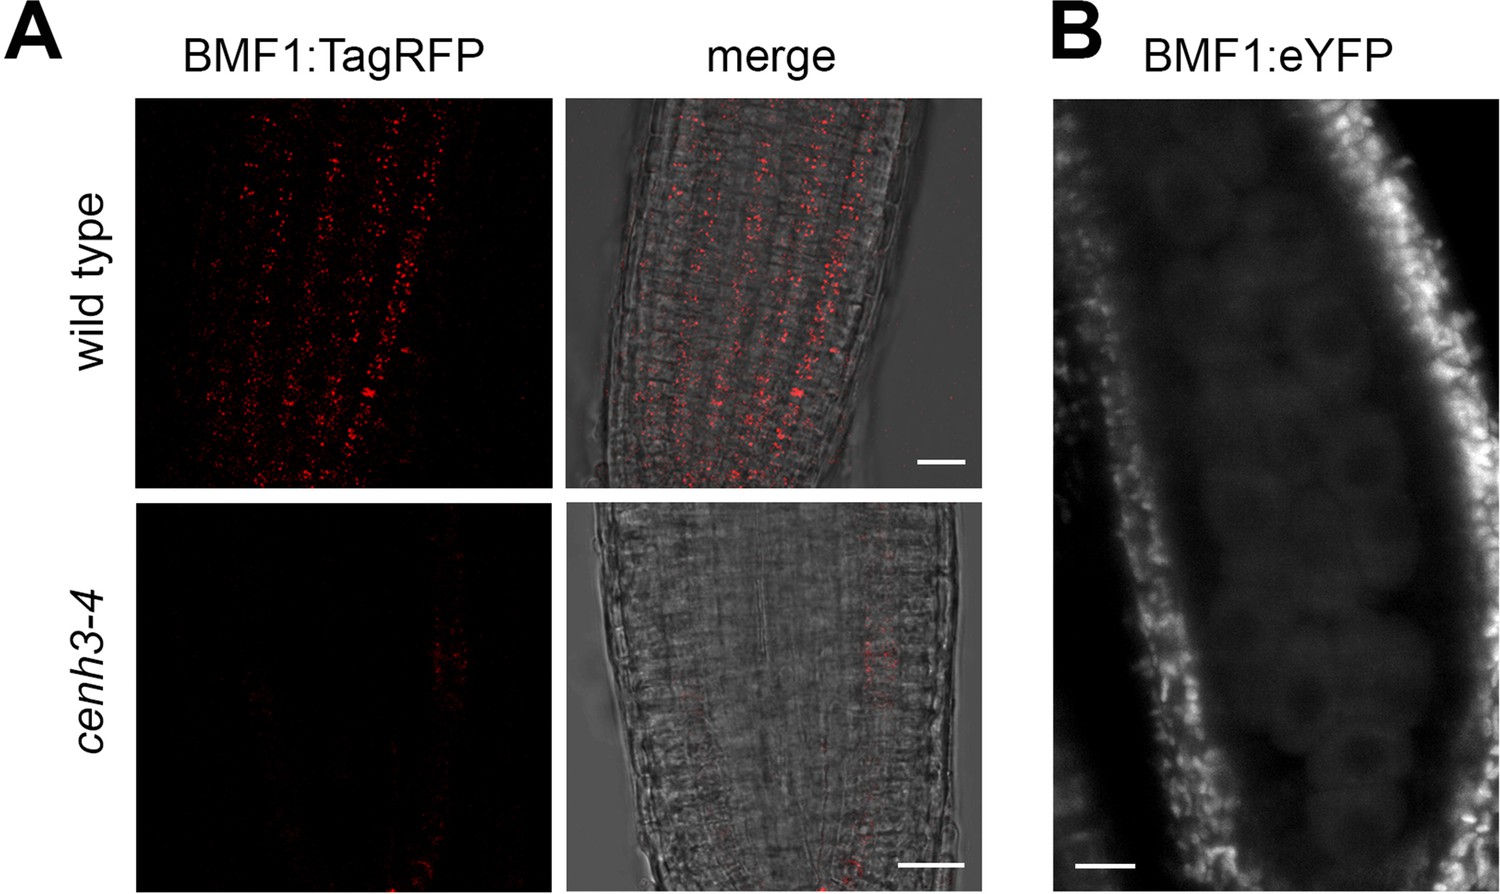
Association of BMF1 with centromeres in cenh3-4 plants.
(A) BMF1:TagRFP signal in roots of wild type and cenh3-4 mutants. The same conditions of image acquisitions were used. Scale bar = 20 µm. (B) No BMF1:eYFP signal is detected in pollen mother cells of cenh3-4 mutants grown at 21°C even when maximum intensity of the excitation laser was used. Scale bar = 20 µm.
Figure 4 with 1 supplement
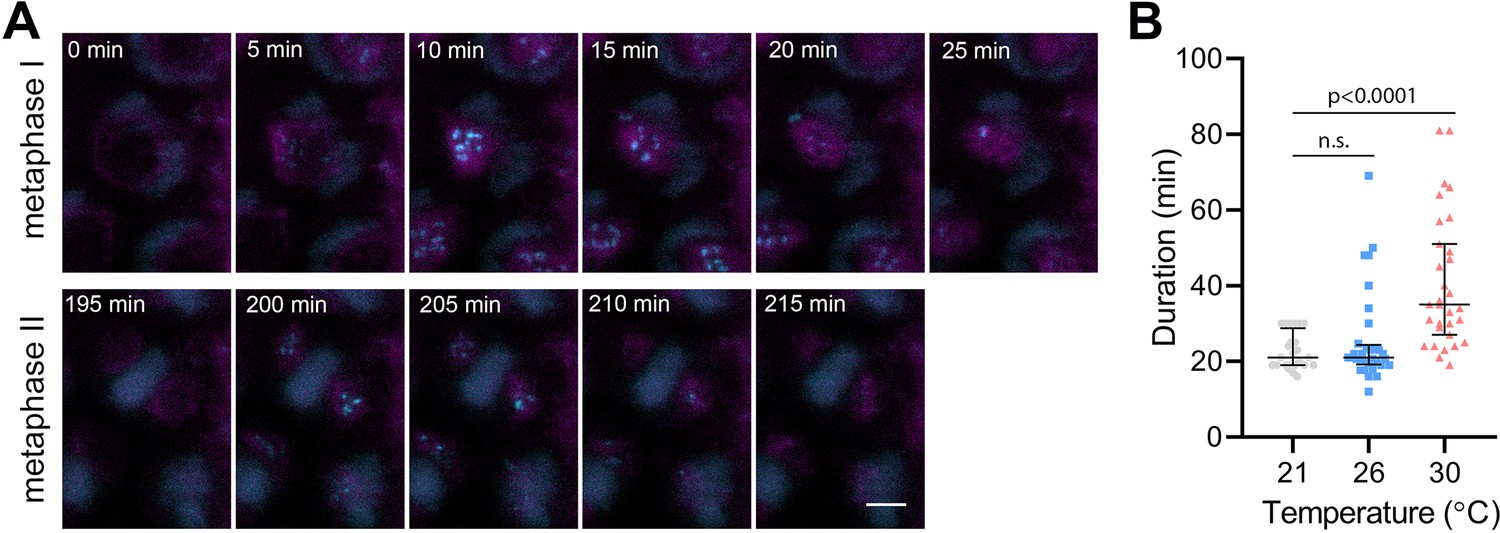
Effect of high temperature on the duration of BMF3:GFP localization during wild type meiosis.
(A) Time lapse series of BMF3:GFP (cyan) and TagRFP:TUB4 (magenta) in pollen mother cell from nuclear envelope breakdown to telophase II. Scale bar = 5 µm. (B) Duration of BMF3:GFP signal in plants grown at 21°C (n=24), 26°C (n=32), and 30°C (n=31). Significance of the difference was calculated via two-tailed t-test. Source values for (B) are available in Source data 1.
Figure 4—figure supplement 1

Association of BMF3 with centromeres in cenh3-4 plants.
(A) BMF3:GFP signal in meiosis I obtained by live cell imaging in pollen mother cells (PMCs) incubated at indicated temperature. Intensity of the BMF3:GFP signal changes in the course of meiosis and the red rectangles indicate PMCs with the peak BMF3:GFP signal intensity. Scale bar = 5 µm. (B) BMF3:TagRFP signal in meiosis I in wild type and cenh3-4 plants obtained by live cell imaging microscopy. Scale bar = 5 µm. (C) Duration of the BMF3:TagRFP signal in PMCs during meiosis I in wild type (n=26) and cenh3-4 (n=31) plants. Each datapoint corresponds to one meiocyte. Significance of the difference assessed by two-tailed t-test is indicated. Source values are available in Source data 1.
Videos
Video 1
Live imaging of meiosis in plants carrying HTA10:RFP chromatin marker grown at 16°C.
Video 2
Live imaging of meiosis in cenh3-4 plants carrying HTA10:RFP chromatin marker grown at 16°C.
Production of micronuclei could be seen in a few pollen mother cells.
Video 3
Live imaging of meiosis in plants carrying HTA10:RFP chromatin marker grown at 21°C.
Video 4
Live imaging of meiosis in plants carrying HTA10:RFP chromatin marker grown at 26°C.
Video 5
Live imaging of meiosis in cenh3-4 plants carrying HTA10:RFP chromatin marker grown at 21°C.
Production of micronuclei could be detected in some pollen mother cells.
Video 6
Live imaging of meiosis in cenh3-4 plants carrying HTA10:RFP chromatin marker grown at 26°C.
Production of micronuclei could be detected in most pollen mother cells.
Video 7
Live imaging of meiosis in plants carrying HTA10:RFP chromatin marker grown at 30°C.
Aberrant meiotic products are detected.
Video 8
Live imaging of meiosis in cenh3-4 plants carrying HTA10:RFP chromatin marker grown at 30°C.
Most pollen mother cells (PMCs) undergo aberrant meiotic division and only a few PMCs undergo normal meiotic division resulting in forming unbalanced tetrads.
Video 9
Live imaging of BMF1:eYFP kinetochore marker (cyan) and HTA10:RFP chromatin marker (magenta) during meiosis.
Video 10
Live imaging of BMF3:GFP spindle assembly checkpoint marker (cyan) and TagRFP:TUB4 tubulin marker (magenta) during both meiosis.
Video 11
Live imaging of BMF3:GFP spindle assembly checkpoint marker (cyan) and TagRFP:TUB4 tubulin marker (magenta) during first meiotic division of plants grown at 26°C.
Video 12
Live imaging of BMF3:GFP spindle assembly checkpoint marker (cyan) and TagRFP:TUB4 tubulin marker (magenta) during the first meiotic division of plants grown at 30°C.
Additional files
-
MDAR checklist
- https://cdn.elifesciences.org/articles/90253/elife-90253-mdarchecklist1-v1.doc
-
Source data 1
Raw source data of measurements used for making graphs and statistics.
- https://cdn.elifesciences.org/articles/90253/elife-90253-data1-v1.xlsx
Download links
A two-part list of links to download the article, or parts of the article, in various formats.
Downloads (link to download the article as PDF)
Open citations (links to open the citations from this article in various online reference manager services)
Cite this article (links to download the citations from this article in formats compatible with various reference manager tools)
Heat stress impairs centromere structure and segregation of meiotic chromosomes in Arabidopsis
eLife 12:RP90253.
https://doi.org/10.7554/eLife.90253.3


