Episodic long-term memory formation during slow-wave sleep
- Institute of Psychology, University of Bern, Switzerland
- Faculty of Psychology, UniDistance Suisse, Switzerland
Figures
Figure 1
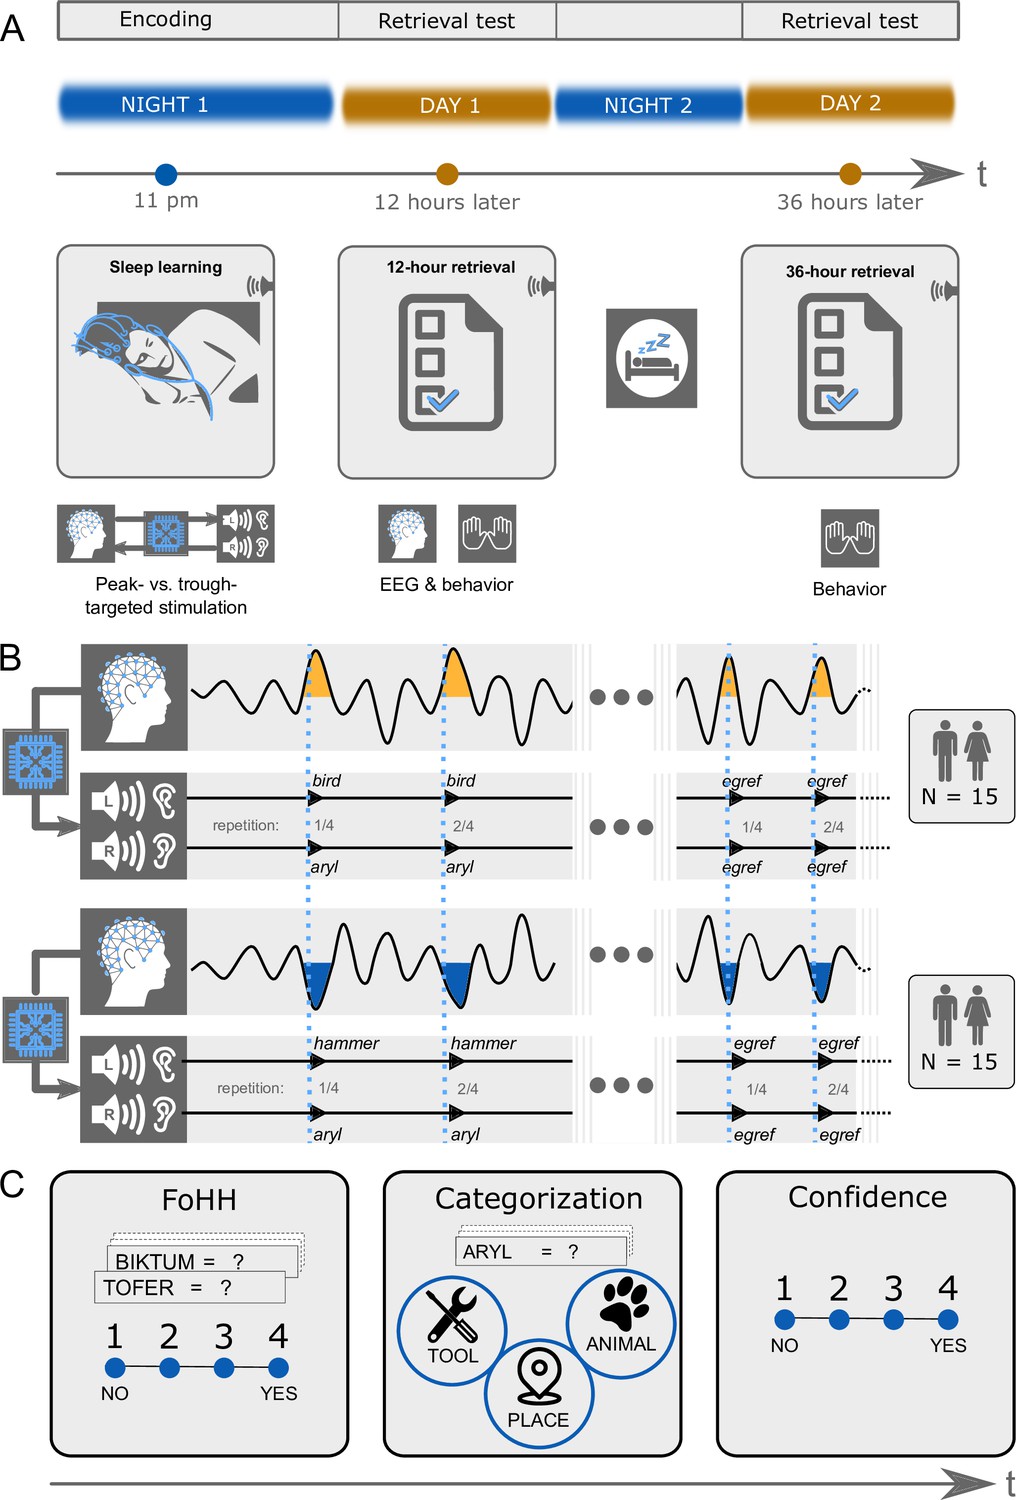
Experimental design.
(A) Design overview: There were three experimental sessions per participant. Thirty participants heard pairs of pseudowords and translation words during sleep starting around 11 pm. They took a first retrieval test at 12 hr and a second retrieval test at 36 hr after the acoustic stimulations during sleep. The EEG was recorded during sleep and during the first retrieval at 12 hr. (B) Experimental conditions: We varied between subjects whether the words were played during peaks or troughs of slow-waves. Within subjects we played pairs of pseudowords and translation words in the experimental condition and pseudowords alone in the control condition. Both word pairs (experimental condition) and pseudowords (control condition) were presented four times in succession to facilitate sleep-learning. In the experimental condition, translation words were played into the left ear and pseudowords into the right ear. (C) Retrieval tasks: Retrieval tasks were the same at the 12 hr and the 36 hr retrieval. Previously sleep-played and new pseudowords were presented at test in both the visual and auditory modality simultaneously (a word appeared on screen and was simultaneously spoken). During each presentation of a pseudoword, participants needed to answer three questions. First, they were asked to indicate whether they had a feeling of having heard (FoHH) the presented word during their sleep in the laboratory. Next, they were asked to assign the presented pseudoword to a superordinate category (animal, tool, place; categorization task). Lastly, they were asked to rate their confidence on a four-point scale regarding their category assignment.
Figure 2 with 4 supplements
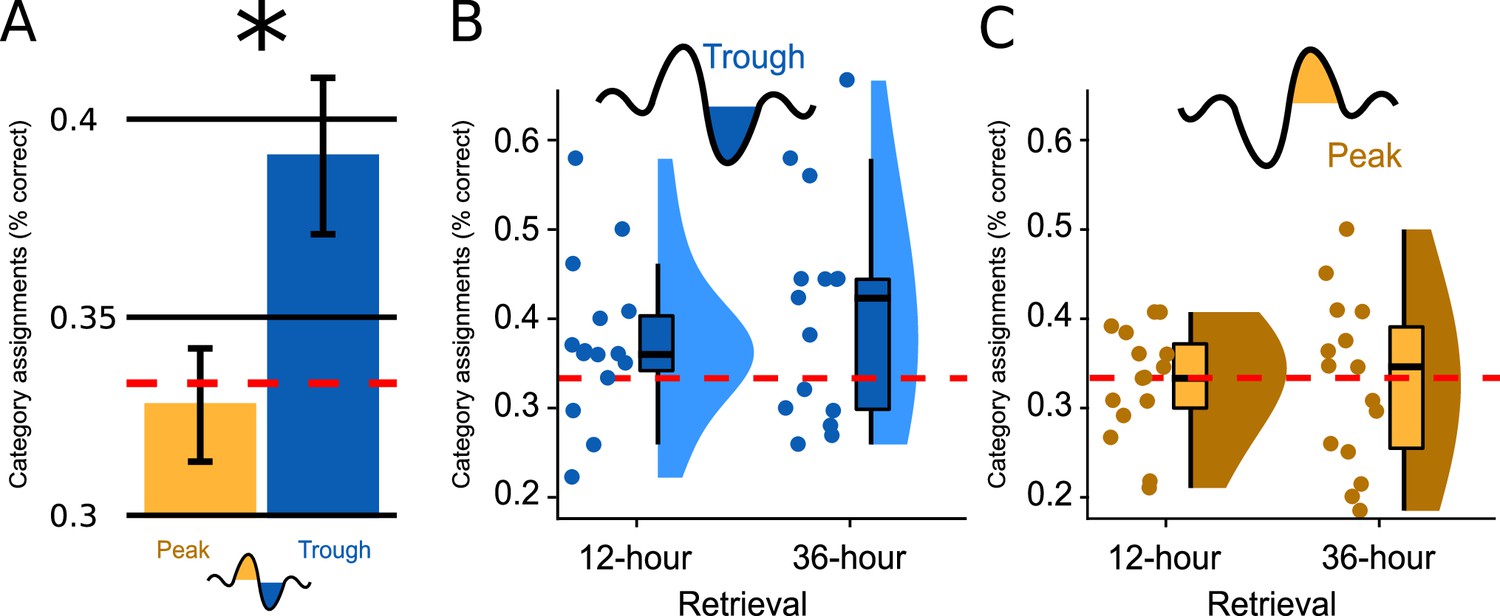
Memory performance.
(A) Bar plots illustrate how well participants had assigned the pseudowords presented at test to a superordinate category in the experimental condition; the data are averaged (SEM) over both retrieval time points (N=30). Categorization accuracy in the Trough condition (blue) was above chance (chance = 1/3 correct assignments; F(1,14)=5.660, p=0.032) and significantly exceeded the chance-level accuracy of the Peak condition (yellow, F(1,28) = 5.237, p=0.030, d=0.865). (B, C) Boxplot of categorization accuracy split by the Peak/Trough condition and by the 12 hr/36 hr retrieval condition (X-axis). Displayed are box plots with median, 95% confidence intervals, density plots and dot plots of the 15 participant average. The red dotted line indicates chance performance (chance = correct assignments).
Figure 2—figure supplement 1

Paired retrieval performance.
Lines connecting participants’ retrieval performance after 12 hr and 36 hr (percentage correct category assignments). Results are faceted for the Trough (A, N=15) and the Peak (B, N=15) conditions. Thick black line depicts the group averages. The red dotted line represents chance-level performance. This is the same data as presented in Figure 2.
Figure 2—figure supplement 2
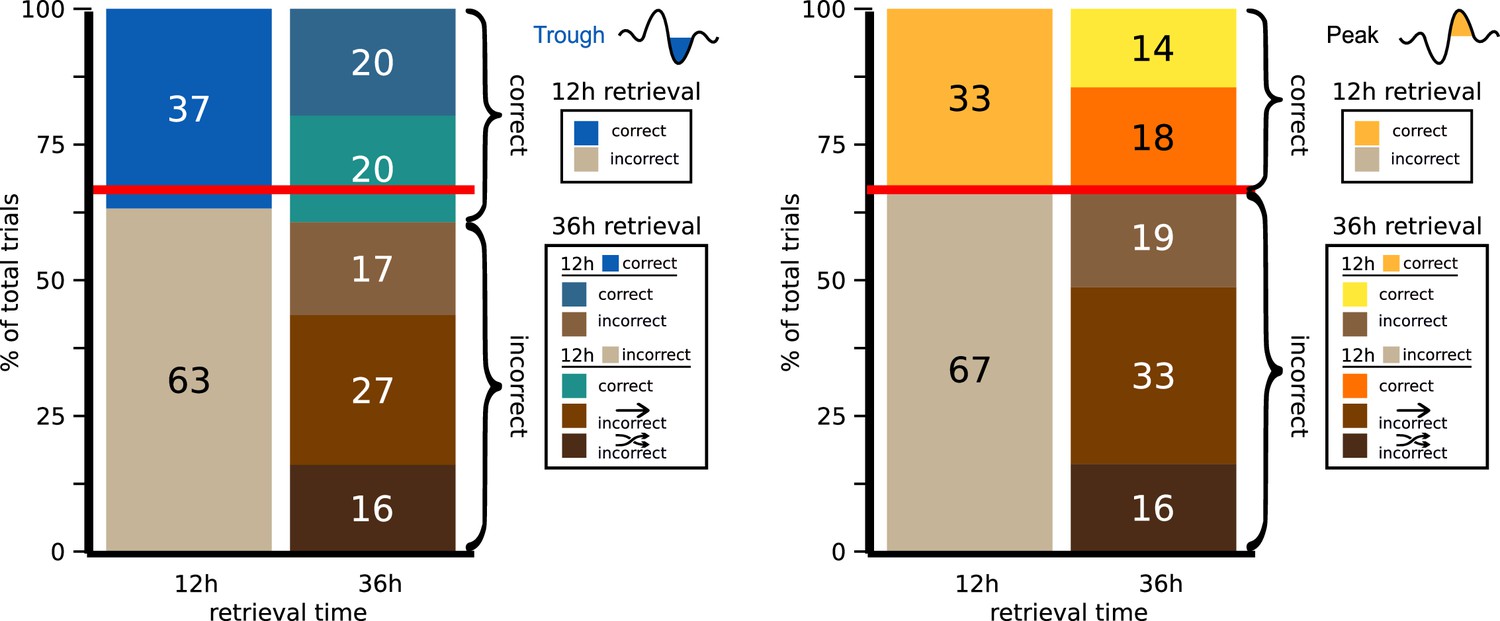
Switching rate of category assignment.
On the left, we present the trial-based answer consistency for the Trough condition (average of 15 participants). Percentage of trials that were assigned to the correct (blue-ish) and incorrect (brown-ish) superordinate category, based on the sleep learned association. Category assignment accuracy is depicted for the retrieval after 12 hr (left) and for the retrieval after 36h (right). The correct responses after 36 hr are either after a correct (dark blue) or an incorrect (turquoise) assignment at 12 hr. Incorrect responses either came from a previously correct assignment (light brown), the same incorrect category assignment (brown) or the other incorrect category (dark brown). Similarly, on the right, we present the switching rate for the Peak condition. Orange-ish are here correctly assigned trials. Please note that at the 36 hr retrieval only 14% were twice correct (yellow, top square), compared to 20% in the Trough condition. Red line represents chance performance to choose an incorrect category that is two out of three categories (0.66%). Straight arrow = consistent incorrect category assignment (e.g. response twice ‘animal’, correct = tool), crossed arrows = inconsistent incorrect category assignment (e.g. correct = building, 12 hr response = animal, 36 hr response = tool).
Figure 2—figure supplement 3
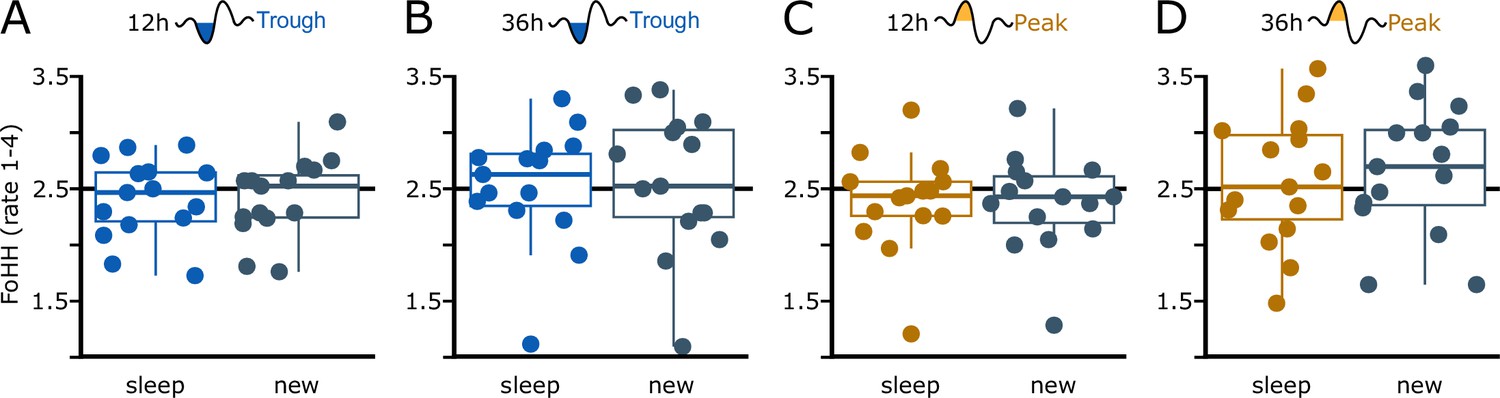
Feeling of having heard (FoHH) for sleep-paired and new pseudowords.
Boxplot of subject averages of FoHH, faceted for sleep-paired (blue or brown) and new (grey) pseudowords. The conditions are from left to right: (A) Trough condition, 12 hr retrieval (blue); (B) Trough condition, 36 hr retrieval (blue); (C) Peak condition, 12 hr retrieval (brown); (D) Peak condition, 36 hr retrieval (brown). The FoHH did not significantly differ between sleep-heard and new pseudowords in all four conditions (all p>0.1, paired t-test). Similarly, an ANOVA of the sleep-paired pseudowords did not yield any significant main effect of stimulation (Peak and Trough), time of retrieval (12 hr and 24 hr) or the interaction (all p<0.1, N=30). The dots represent each subject’s average.
Figure 2—figure supplement 4
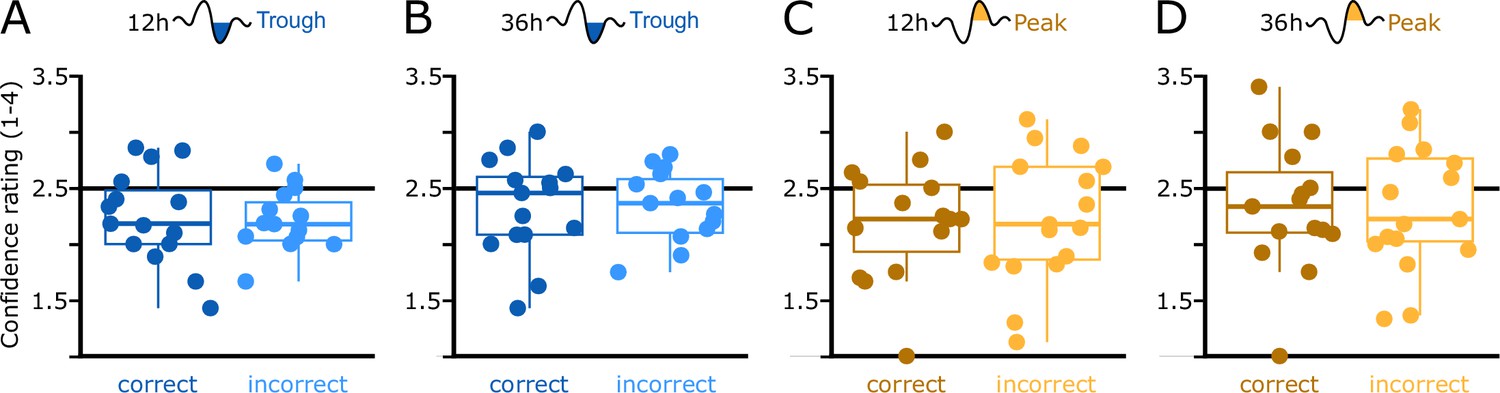
Confidence ratings of category assignments, separated by retrieval accuracy.
Confidence ratings did not differ between correctly or incorrectly categorized pseudowords (all p<0.5, paired t-test): (A) in the Trough condition after 12 hr (blue, left), (B) in the Trough condition after 36 hr (blue, right), (C) in the Peak condition after 12 hr (brown, left) and (D) in the Peak condition after 36 hr (brown, right). Confidence ratings ranged from one to four. An ANOVA, also including the ratings of new pseudowords, did not yield a main effect of stimulation (Peak and Trough), time of retrieval (12 hr and 24 hr), presentation (sleep-heard, new) or any interaction (all p<0.2, N=30).
Figure 3 with 1 supplement
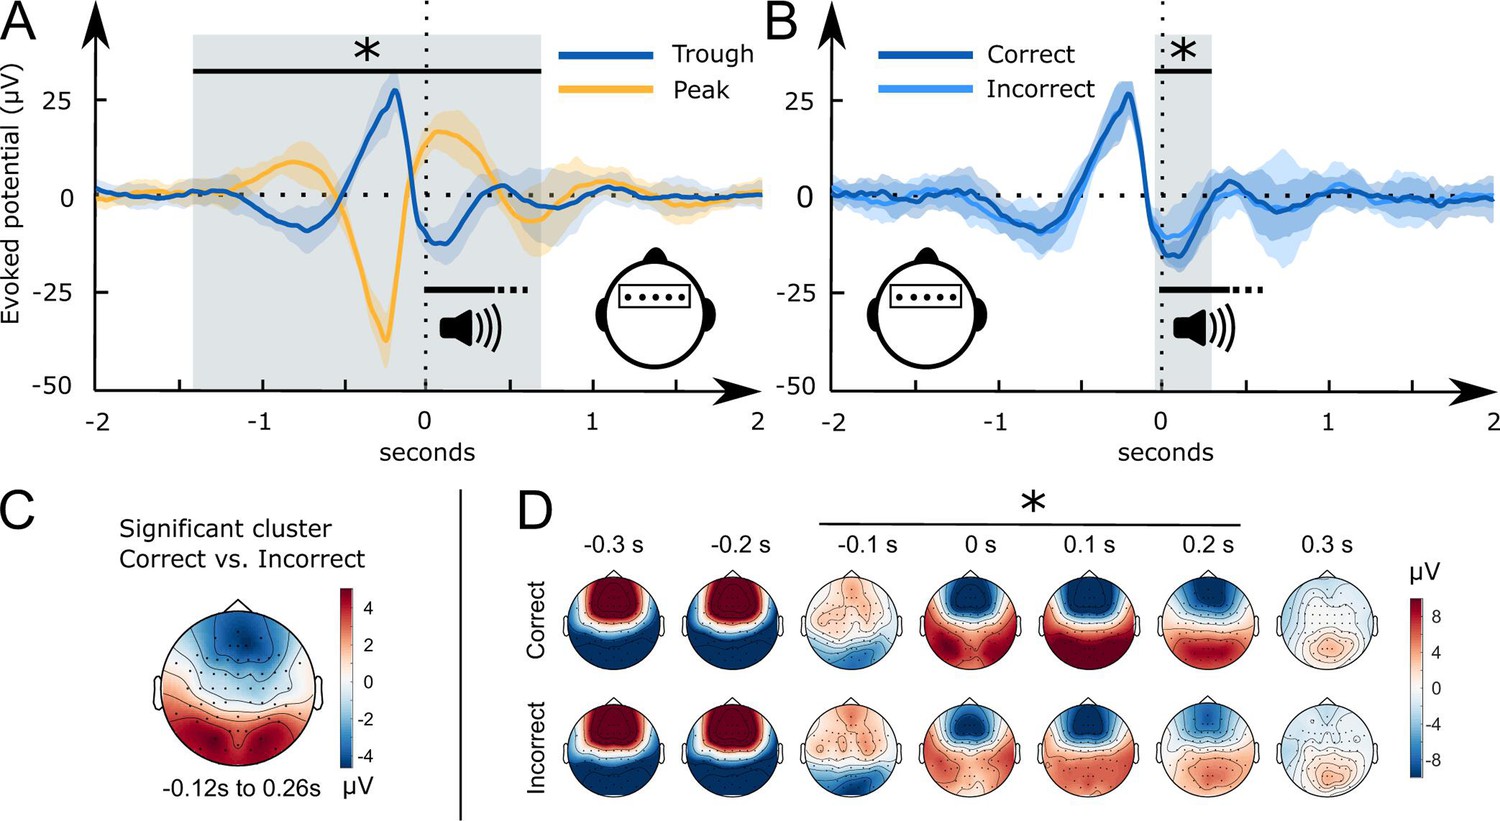
Word-related EEG potentials recorded during sleep.
(A) Word pair-related voltage response plotted for the Trough condition (blue) and the Peak condition (yellow, SD is shaded). (B) Comparison of subsequently correctly (dark blue) and incorrectly (light blue) assigned pseudowords to categories at the 36 hr retrieval in the Trough condition (N=15). (C) Topographical voltage distributions of the averaged significant cluster for the contrast of correct versus incorrect category assignments at the 36 hr retrieval. (D) Time course of the topographical voltage distribution for correctly and incorrectly assigned pseudowords at the 36 hr retrieval. * indicates significant time points; cluster-level Monte Carlo p<0.05. Shaded areas represent the standard deviation between subjects. All trials are sorted with reference to the word onset (0 seconds, vertical dotted line).
Figure 3—figure supplement 1
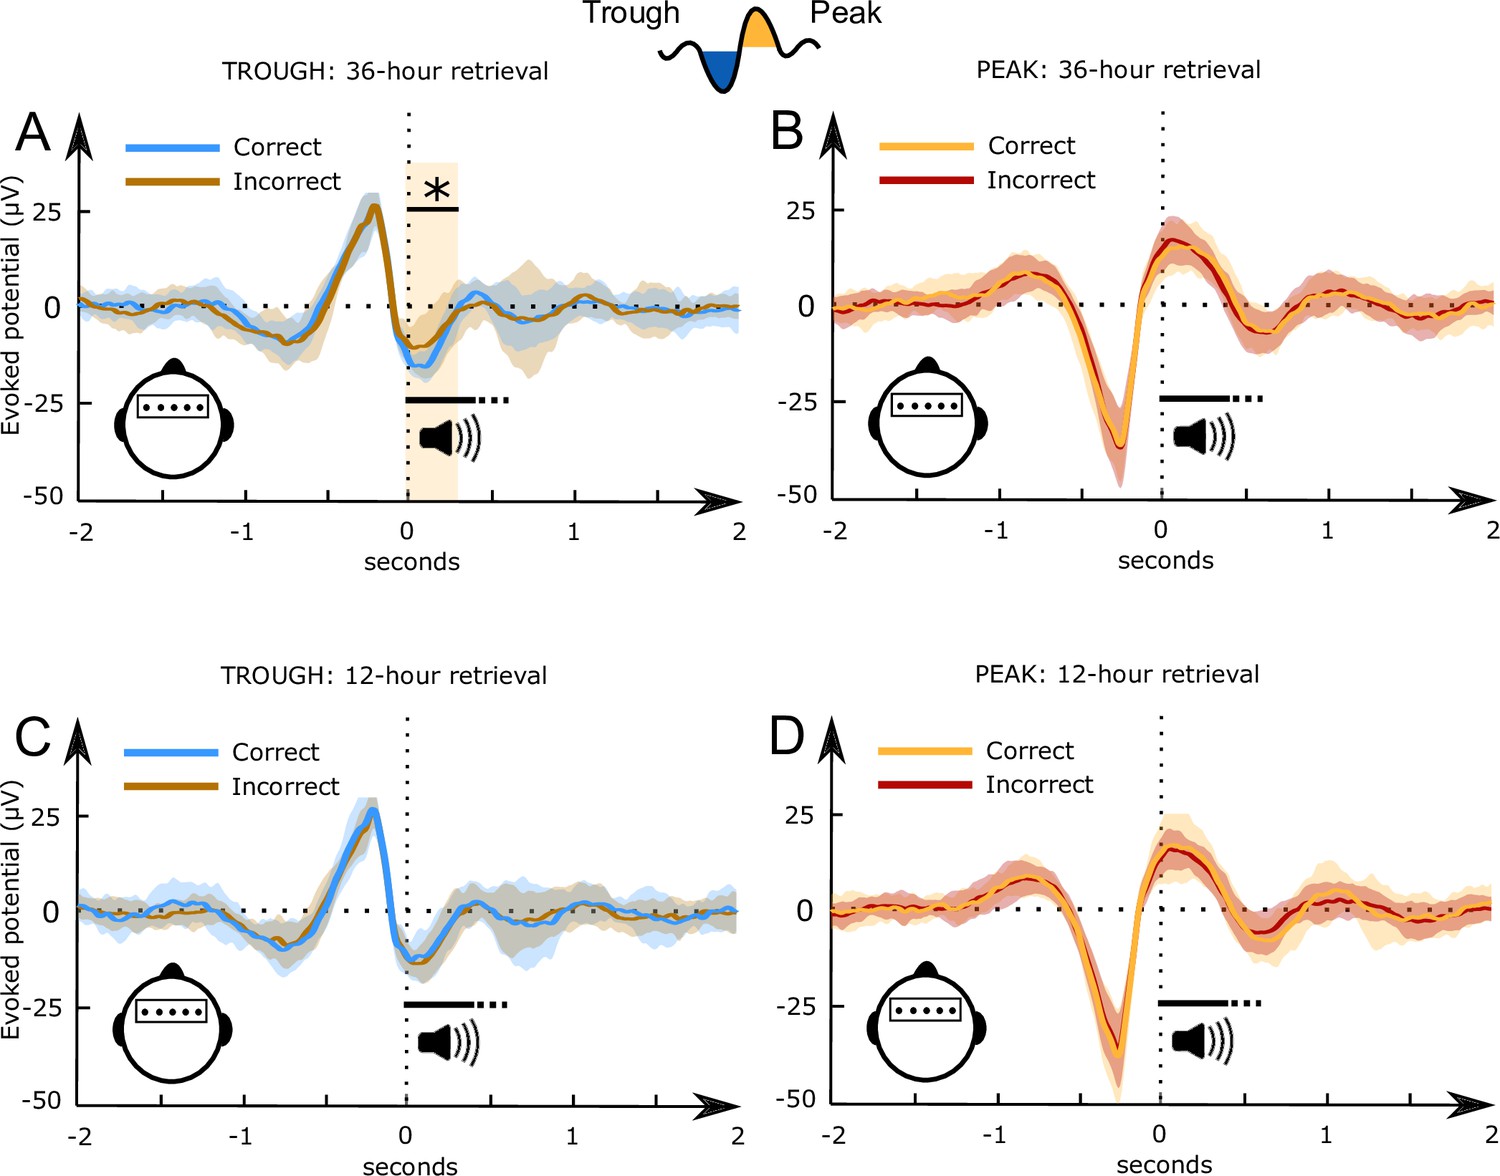
Accuracy-related evoked EEG potentials recorded during sleep.
Comparison of word-related potentials measured during slow-wave sleep for later (12 hr retrieval in the bottom row and 36 hr retrieval in the top row) correctly and incorrectly assigned foreign words to superordinate categories. The left side displays voltage changes in relation to the targeted troughs (A, C) and the right side in relation to the target peaks (B, D). *, significant time point, cluster-level Monte Carlo p=0.016. Shaded areas represent the standard deviation between subjects. All trials are sorted with reference to the word onset (0 seconds, vertical dotted line).
Figure 4 with 1 supplement
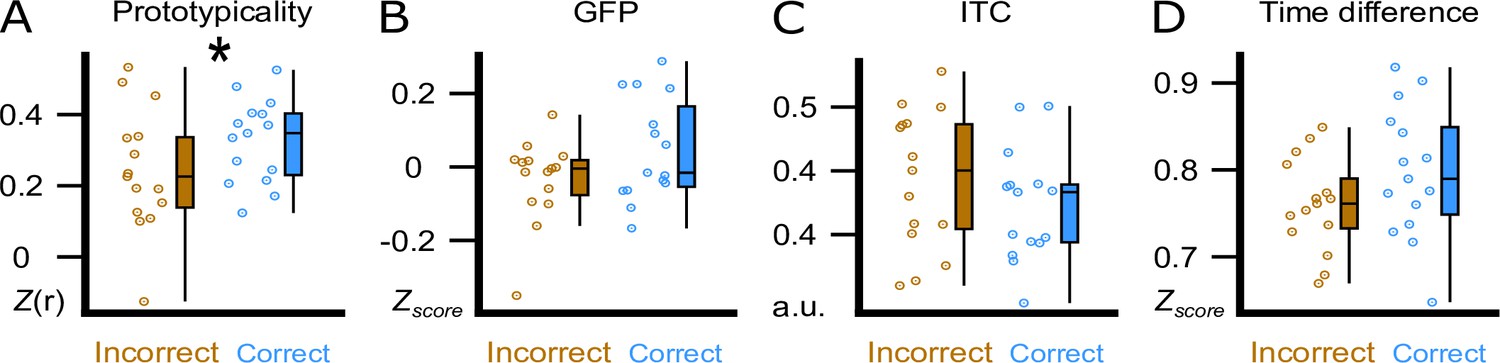
Trough features compared between correct and incorrect category assignments at the 36 hr retrieval.
We display the comparison between correctly (blue) and incorrectly (brown) assigned pseudowords in the experimental condition at the 36 hr retrieval. (A) Using the amplitude of the correlation between the ERP and the template (Prototypicality, Fisher’s z) at word onset. (B) Using global field power (GFP, z-score) of the ERP at word onset. (C) Using the inter-trial phase coherence (ITC, a.u.) between the four presentations of a word pair. (D) Using the time difference (Time Difference, z-score) between the actual acoustic stimulation and the measured trough maximum. Participant averages (dots), group median (line) and 95% confidence intervals (whiskers) are displayed as boxplots. * indicates a significant difference, p=0.005 (paired t-test, N=15).
Figure 4—figure supplement 1

Trough features compared between correct and incorrect category assignments at the 12 hr retrieval.
The same analysis as shown in Figure 4 of the manuscript, but for accuracy measured at the 12 hr retrieval. We display the comparison between correctly (blue) and incorrectly (brown) assigned foreign words in the experimental condition at the 12 hr retrieval using the amplitude of the correlation between the ERP and the template (Prototypicality) at word onset (A), using global field power (GFP) of the ERP at word onset (B), using the inter-trial phase coherence (ITC) between the four presentations of a word pair (C), and using the time difference (Time Difference) between the actual acoustic stimulation and the measured trough maximum (D). All paired t-test did not reveal a significant difference (p>0.15, N=15). Participant averages (dots), group averages (vertical black line) and 95% confidence intervals (whiskers) are displayed.
Figure 5

Theta and fast spindle power following word onset.
Time course of the topographical distribution of theta (A) and fast spindle (B) power, shown for the experimental condition (EC), where word pairs were played, and for the control condition (CC), where pseudowords were played (left, average of representative electrodes). The blue box demarcates clusters that reflect a significant difference between EC and CC (*: cluster-level Monte Carlo p<0.05, N=15). Topographical distribution of the theta and the fast spindle power averaged over the significant time period and electrode displayed for the experimental condition (EC, top) and the control condition (CC, bottom) in the Trough condition. Correlation of the theta enhancement and the fast spindle enhancement measured from the cluster of significant electrodes with the individual accuracy of category assignments in the experimental condition at the 36 hr retrieval (right).
Figure 6
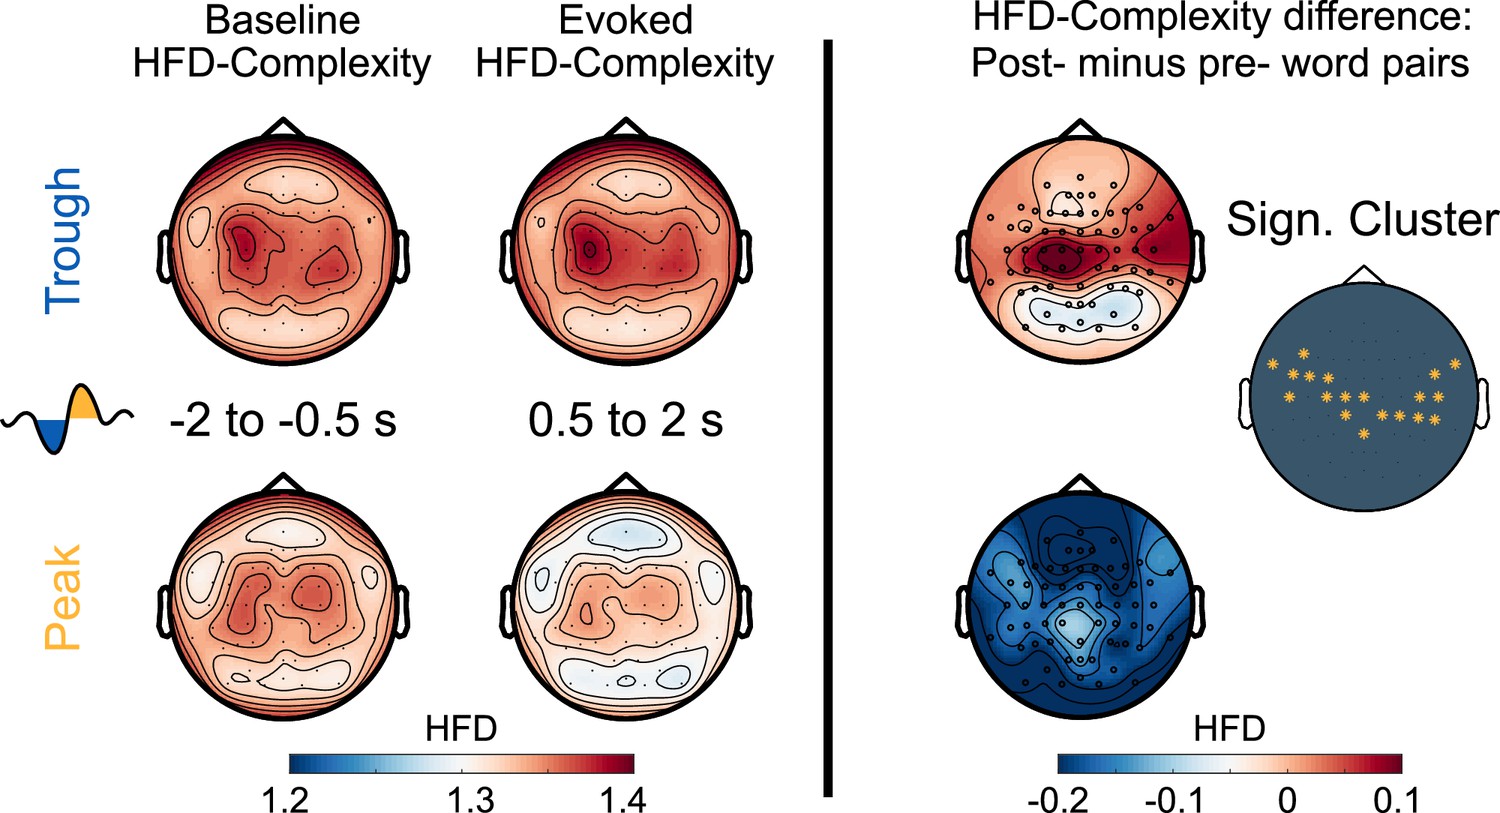
Neural complexity.
EEG-derived neural complexity measured as Higuchi Fractal Dimension (HFD) displayed for the Trough condition and the Peak condition before the presentation of word pairs (Baseline) and following the presentation of word pairs (Evoked) in the experimental condition. The right panel displays the significant difference between the Trough and the Peak condition in the neural complexity gain from before to following word onset (*cluster-level Monte Carlo: p=0.002, N=15).
Figure 7
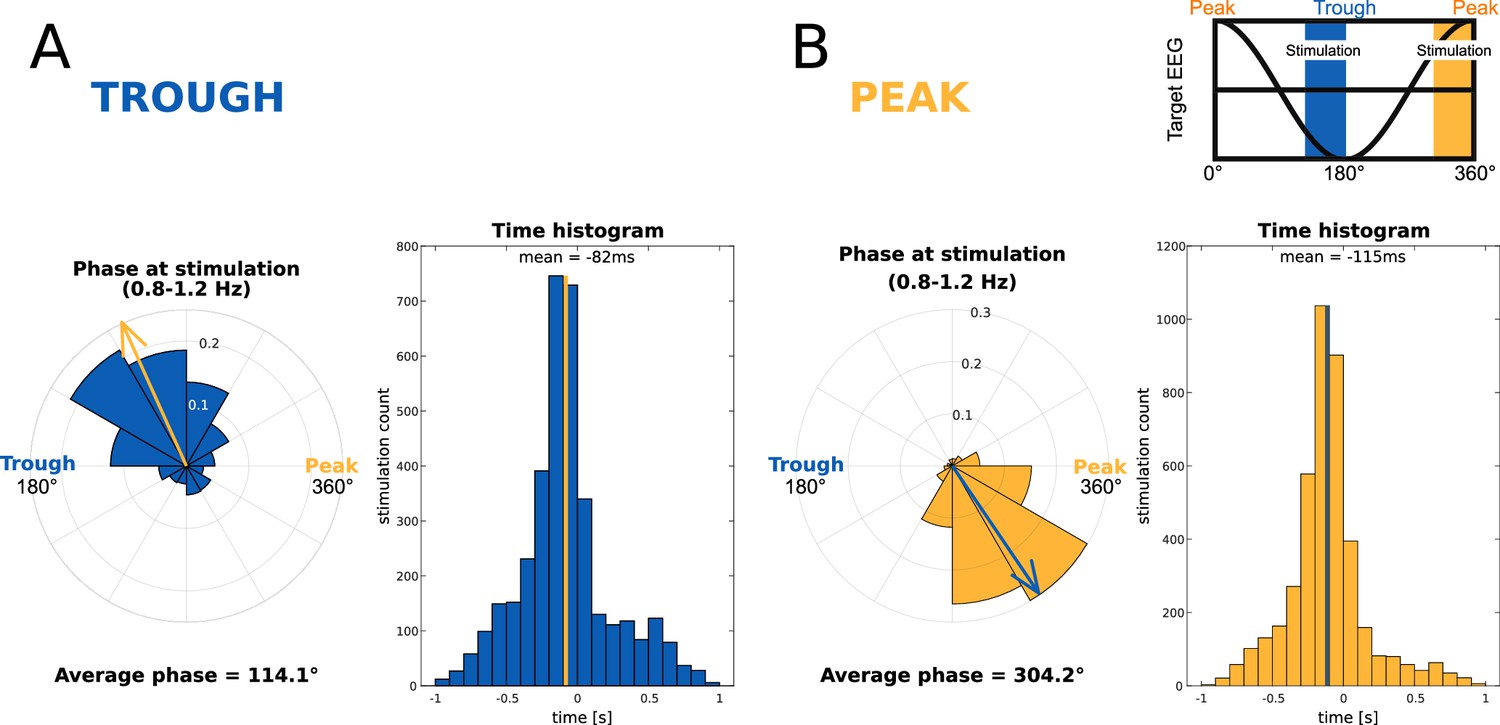
Accuracy of the targeting of slow-wave phase.
Utterance into a half-wave of a slow-wave. The mean word onset was 113 ms before peak maxima (all stimulations). Data showing the precision of phase targeting for slow-wave Troughs (A, N=15, blue) and Peaks (B, N=15, yellow). On the left side in A and B, we present rose plots that indicate the phase of slow-wave filtered voltage (08.–1.2 Hz). The arrows demarcate the average phase of acoustic stimulation; 360° represents a peak and 180° represents for a trough. On the right side in A and B, we present the histogram illustrating the time delay between a real peak/trough and the acoustic stimulation. The highlighted line indicates the average of all trials. On the top right is a translation of slow-wave phases into angles, colors depict the targeted slow-wave phases. We targeted the acoustic stimulation ahead of the local maxima (peak or trough) to fit the entire word utterance into a peak/trough. The onset of word presentation was on average 82 ms or 66° before the trough maximum and 115 ms or 54° before the peak maximum.
Author response image 1

Author response image 2

Author response image 3

Additional files
Download links
A two-part list of links to download the article, or parts of the article, in various formats.
Downloads (link to download the article as PDF)
Open citations (links to open the citations from this article in various online reference manager services)
Cite this article (links to download the citations from this article in formats compatible with various reference manager tools)
Episodic long-term memory formation during slow-wave sleep
eLife 12:RP89601.
https://doi.org/10.7554/eLife.89601.3


