Replication Study: Systematic identification of genomic markers of drug sensitivity in cancer cells
- Indigo Biosciences, United States
- Pennsylvania State University, United States
Figures
Figure 1 with 1 supplement

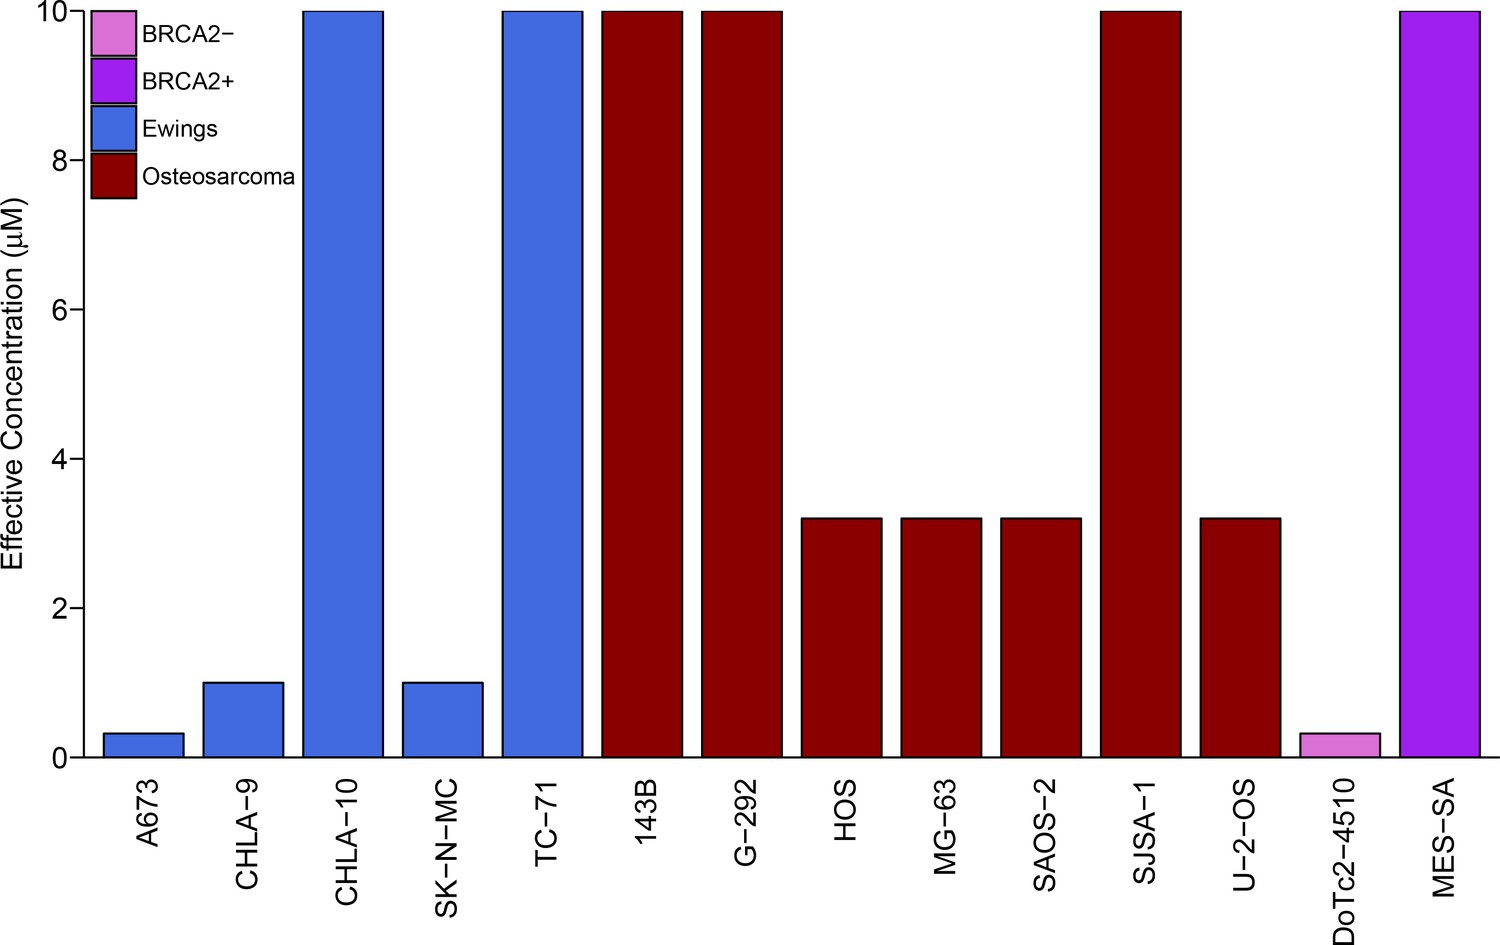
Sensitivity of Ewing’s sarcoma cell lines to olaparib.
Colony formation assays were performed on the indicated cell lines in the presence of a range of olaparib concentrations (0.1, 0.32, 1, 3.2, or 10 µM) or vehicle control (DMSO). Plates were retreated every 3 or 4 days, fixed and stained 7–21 days following plating, and colonies counted. The effective concentration displayed for each cell line is defined as the concentration that reduced colony formation by greater than 90% compared to vehicle control. For G-292 cells, where the highest olaparib concentration tested (10 µM) did not inhibit colony formation by at least 90%, the effective concentration was defined as 10 µM. Wilcoxon-Mann-Whitney test for ordinal data comparing the effective concentrations of Ewing’s sarcoma cell lines to osteosarcoma cell lines; U = 12, p=0.390. Additional details for this experiment can be found at https://osf.io/zy3s5/.
Figure 1—figure supplement 1
Repeat of colony formation assay.
This is a repeat of the same experiment as in Figure 1. G-292 cells, did not inhibit colony formation by at least 90% at the highest olaparib concentration tested (10 µM) and was thus defined as 10 µM. Wilcoxon-Mann-Whitney test for ordinal data comparing the effective concentrations of Ewing’s sarcoma cell lines to osteosarcoma cell lines; U = 11, p=0.302. Additional details for this experiment can be found at https://osf.io/zy3s5/.
Figure 2 with 1 supplement
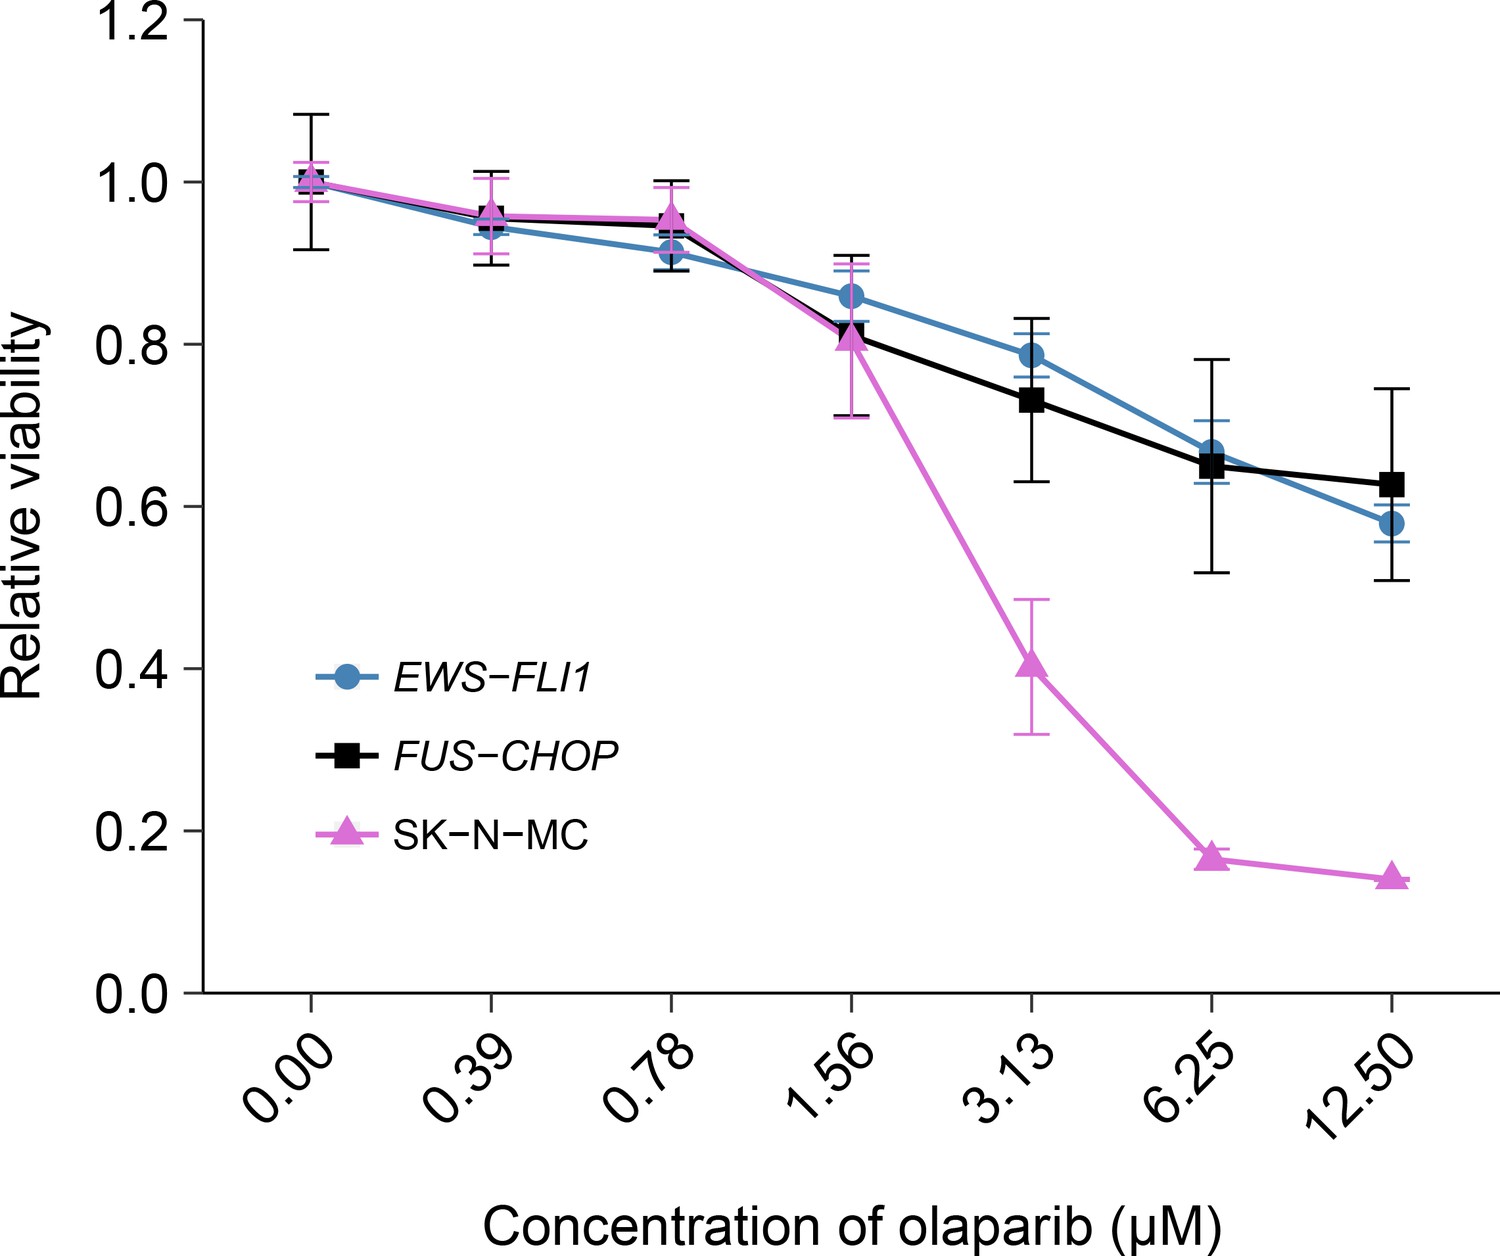
Olaparib sensitivity in cells transformed with the EWS-FLI1 rearrangement.
Cell viability assays were performed for EWS-FLI1 and FUS-CHOP transformed mouse mesenchymal cells, as well as the human Ewing’s sarcoma cell line (SK-N-MC), which harbors the EWS-FLI1 fusion. Cells were treated with the indicated doses of olaparib and 72 hr later cell viability was determined. Relative viability was calculated as a percentage of vehicle control treated cells. Means reported and error bars represent SD from three independent biological repeats. Additional details for this experiment can be found at https://osf.io/t3dm6/.
Figure 2—figure supplement 1
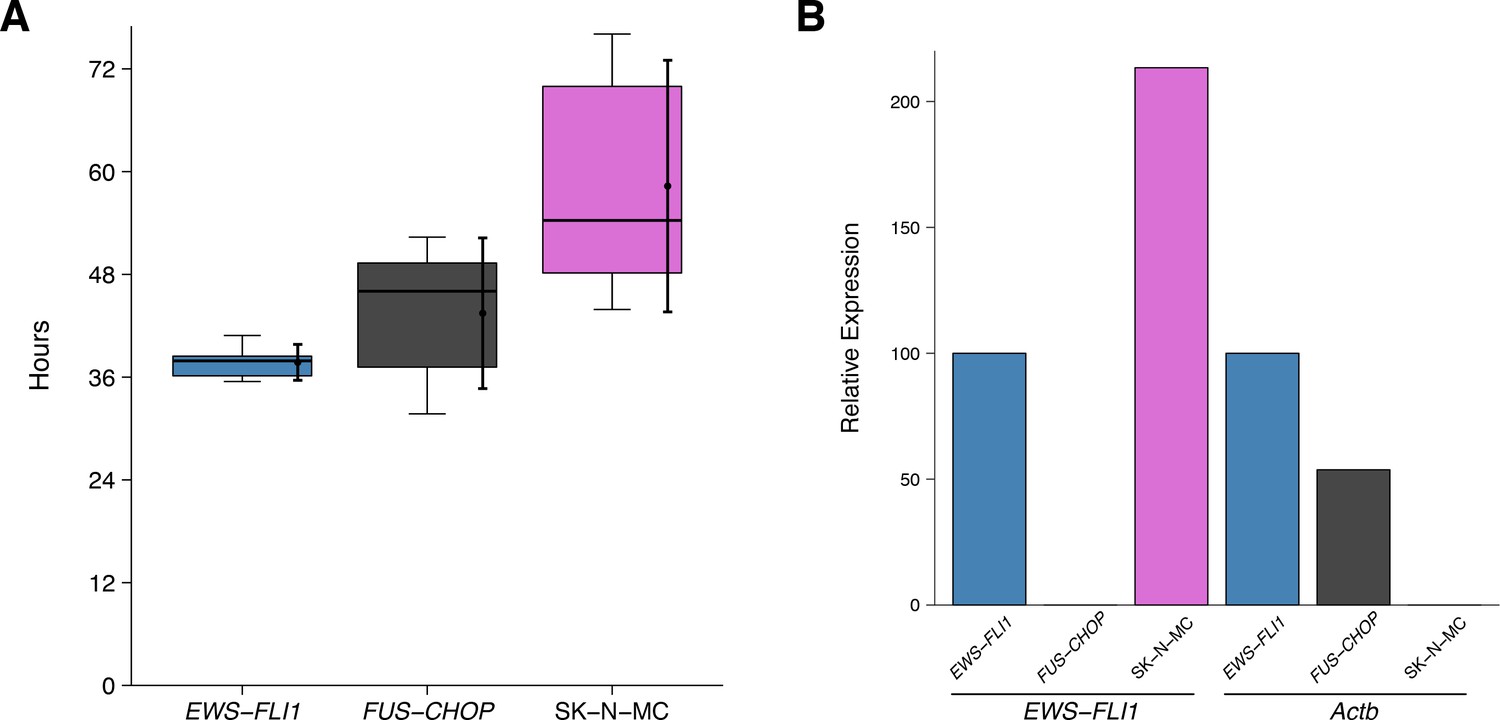
Population doubling time of cells and confirmation of EWS-FLI1 rearrangement.
(A) For each cell line, relative viability of untreated and vehicle control treated cells at 24 and 72 hr after treatment with olaparib were used to determine the population doubling times. Box and whisker plot with median represented as the line through the box and whiskers representing values within 1.5 IQR of the first and third quartile. Means as black dot and bold error bars represent 95% CI (n = 6). (B) Relative expression levels of EWS-FLI1 and Actb were determined by qRT-PCR for each cell line. Expression level of EWS-FLI1 transformed mouse mesenchymal cells was assigned a value of 100. Means reported from one biological repeat. Actb, a housekeeping gene for the mouse mesenchymal cells, was not expected to be expressed in SK-N-MC cells, which are human. The EWS-FLI1 transformed mouse mesenchymal cells contain the EWS-FLI1 fusion gene from SK-N-MC cells (Riggi et al., 2005). Additional details for this experiment can be found at https://osf.io/t3dm6/.
Figure 3 with 1 supplement
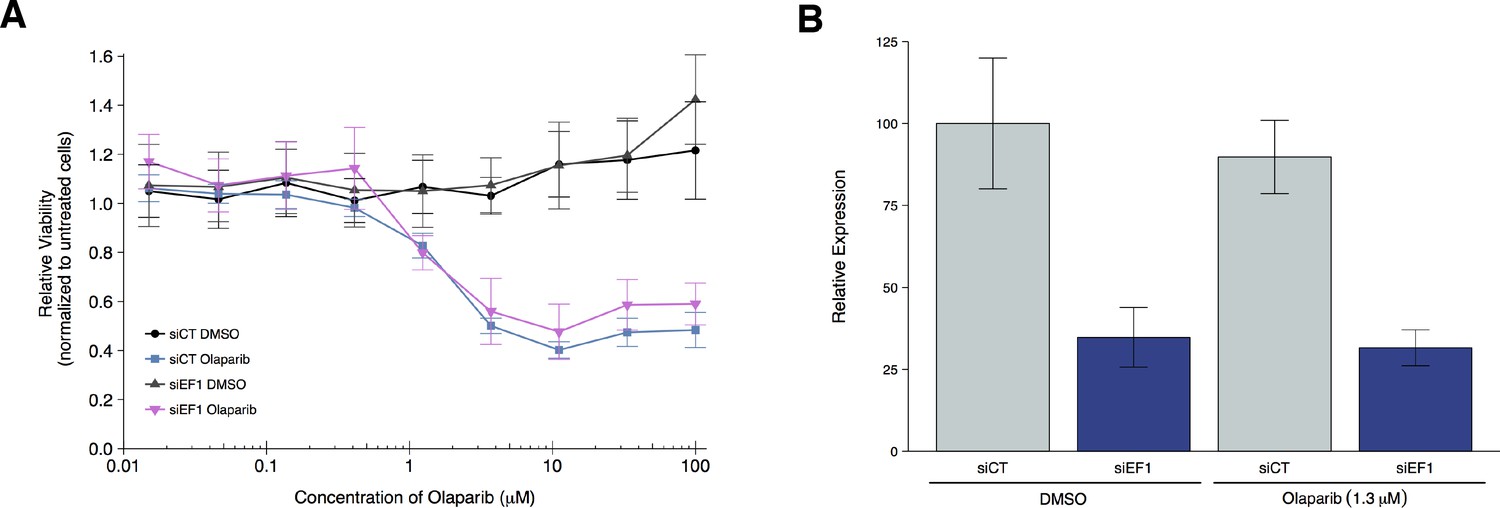
Olaparib sensitivity after depletion of EWS-FLI1 from A673 cells.
A673 Ewing’s sarcoma cells transiently transfected with negative control siRNA (siCT) or an siRNA targeting the EWS-FLI1 translocation (siEF1). (A) Cell viability assays were performed with the indicated doses of olaparib, or an equivalent volume of vehicle control (DMSO). After 72 hr of treatment cell viability was determined. Relative viability was calculated as a percentage of untreated cells. Means reported and error bars represent SD from three independent biological repeats. (B) siRNA-mediated depletion of EWS-FLI1 was determined after 72 hr treatment with vehicle control (DMSO) or olaparib. Relative expression levels of EWS-FLI1 expression normalized to RPLP0 (ribosomal protein lateral stalk subunit P0) was determined by qRT-PCR. Expression level of siCT cells treated with DMSO was assigned a value of 100. Means reported and error bars represent SD from three independent biological repeats. Two-way ANOVA main effect for siRNA (siCT or siEF1); F(1,12) = 96, p=4.46×10⁻⁷. Pairwise contrast between DMSO treated cells transfected with siCT or siEF1; t(12) = 7.32, uncorrected p=9.17×10⁻⁶ with a priori alpha level = 0.025; (Bonferroni corrected p=1.83×10⁻⁵). Pairwise contrast between olaparib treated cells transfected with siCT or siEF1; t(12) = 6.53, uncorrected p=2.80×10⁻⁵ with a priori alpha level = 0.025; (Bonferroni corrected p=5.60×10⁻⁵). Additional details for this experiment can be found at https://osf.io/2w22x/.
Figure 3—figure supplement 1
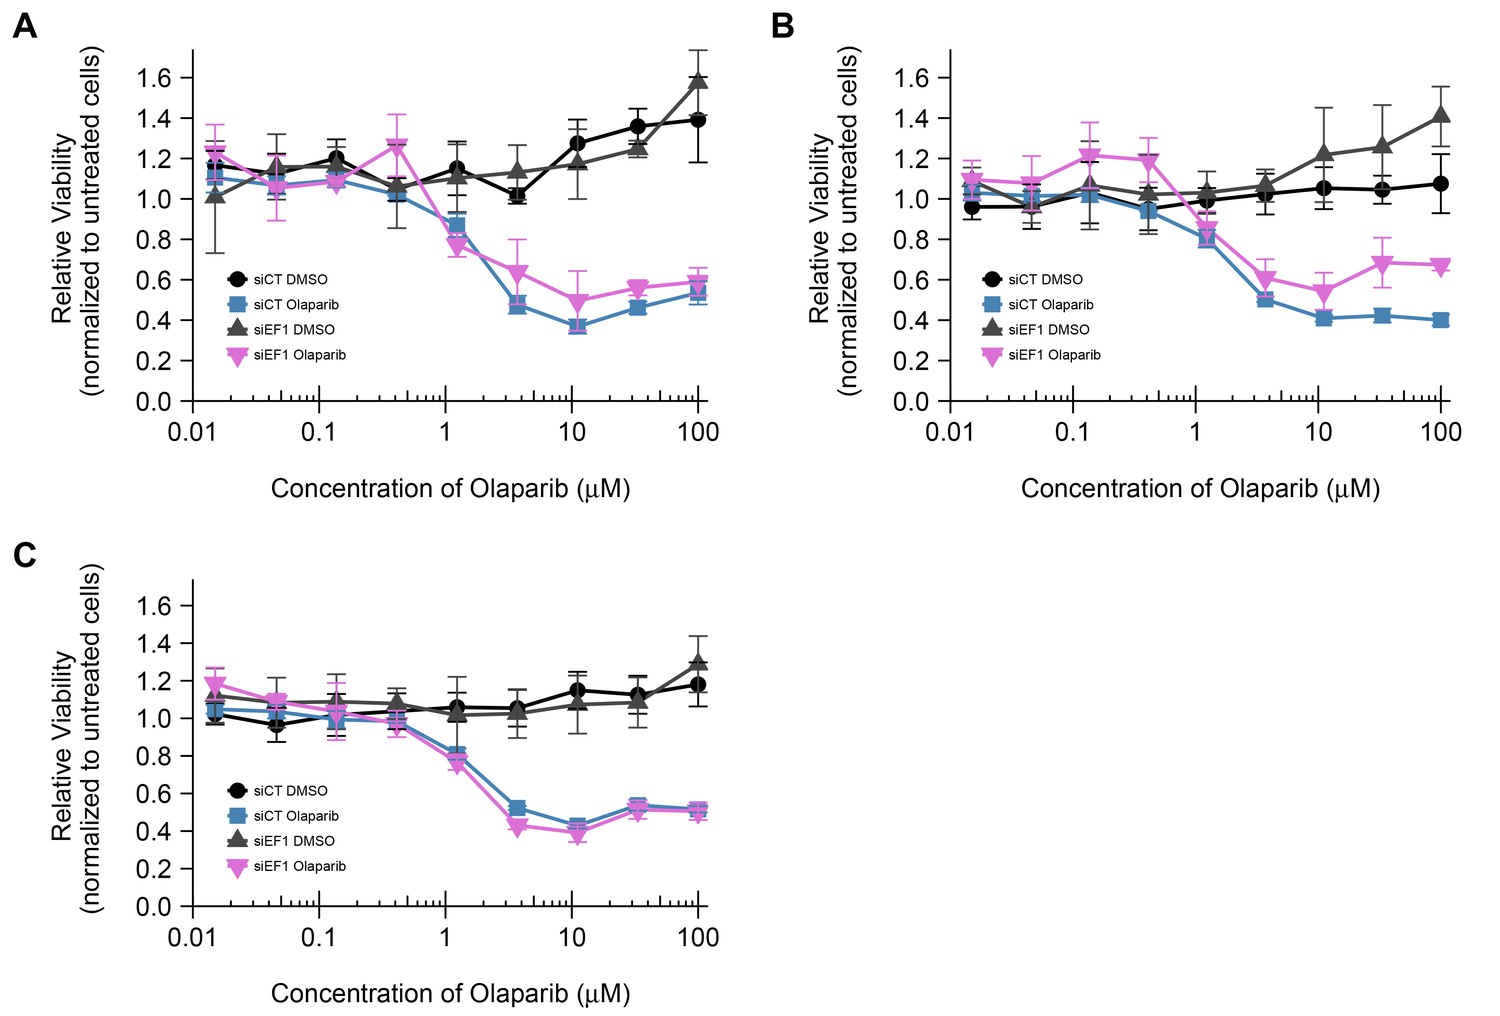
Cell viability assays for each biological repeat.
This is the same experiment as in Figure 3. The line graph of each biological repeat is plotted individually. Means reported and error bars represent SD from three technical replicates for each measurement. Additional details for this experiment can be found at https://osf.io/2w22x/.
Figure 4
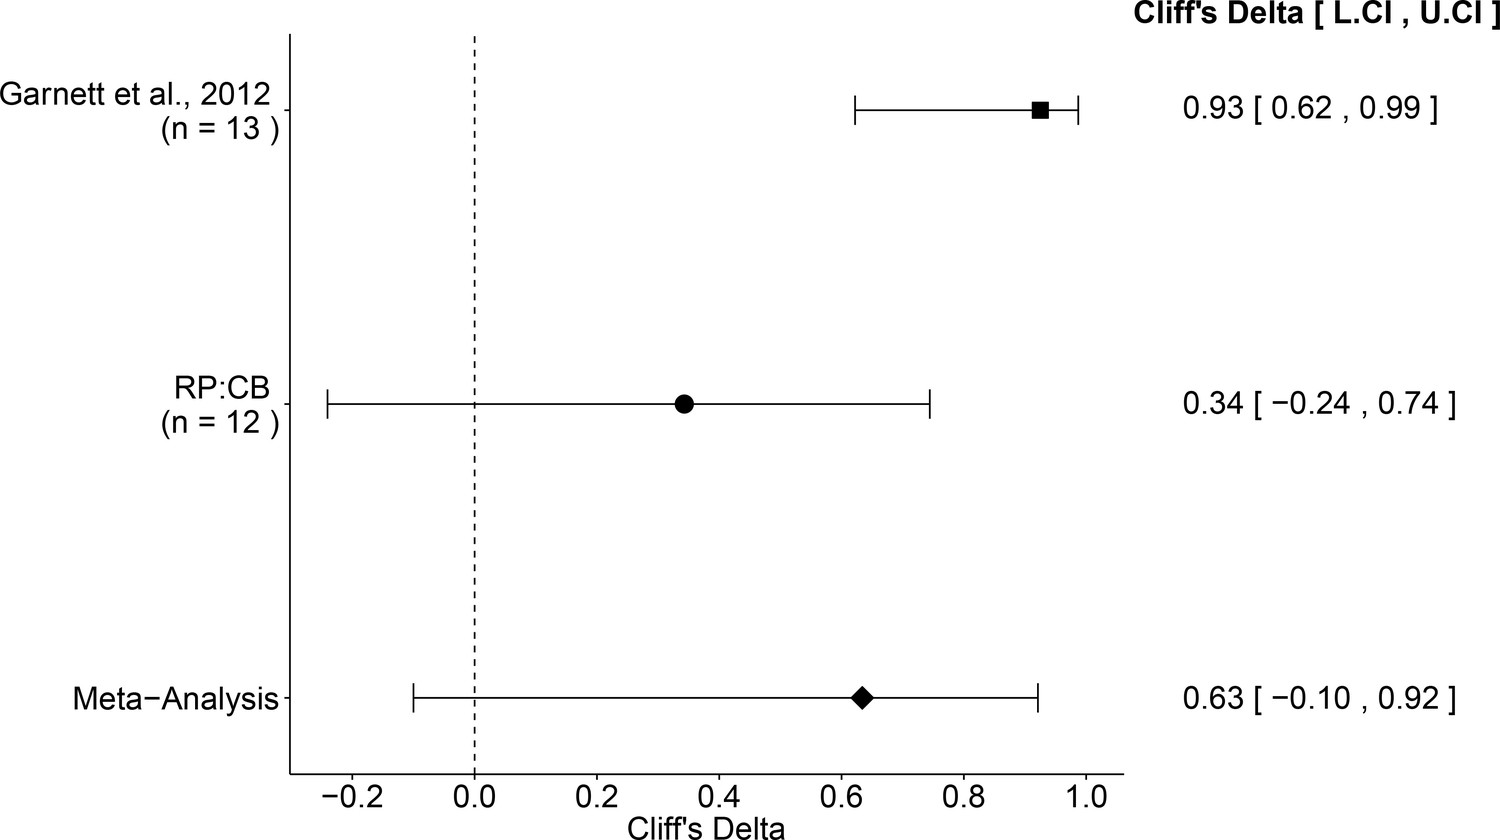
Meta-analysis of effect.
Effect size and 95% confidence interval are presented for Garnett et al. (2012), this replication attempt (RP:CB), and a random effects meta-analysis of those two effects. Sample sizes used in Garnett et al. (2012) and this replication attempt are reported under the study name. Random effects meta-analysis of effective concentrations of Ewing’s sarcoma cell lines to osteosarcoma cell lines from colony formation assays (meta-analysis p=0.029). Additional details for this meta-analysis can be found at https://osf.io/whs6e/.
Additional files
-
Transparent reporting form
- https://doi.org/10.7554/eLife.29747.009
Download links
A two-part list of links to download the article, or parts of the article, in various formats.
Downloads (link to download the article as PDF)
Open citations (links to open the citations from this article in various online reference manager services)
Cite this article (links to download the citations from this article in formats compatible with various reference manager tools)
Replication Study: Systematic identification of genomic markers of drug sensitivity in cancer cells
eLife 7:e29747.
https://doi.org/10.7554/eLife.29747


