Replication Study: Fusobacterium nucleatum infection is prevalent in human colorectal carcinoma
- ARQ Genetics, United States
Figures
Figure 1 with 2 supplements
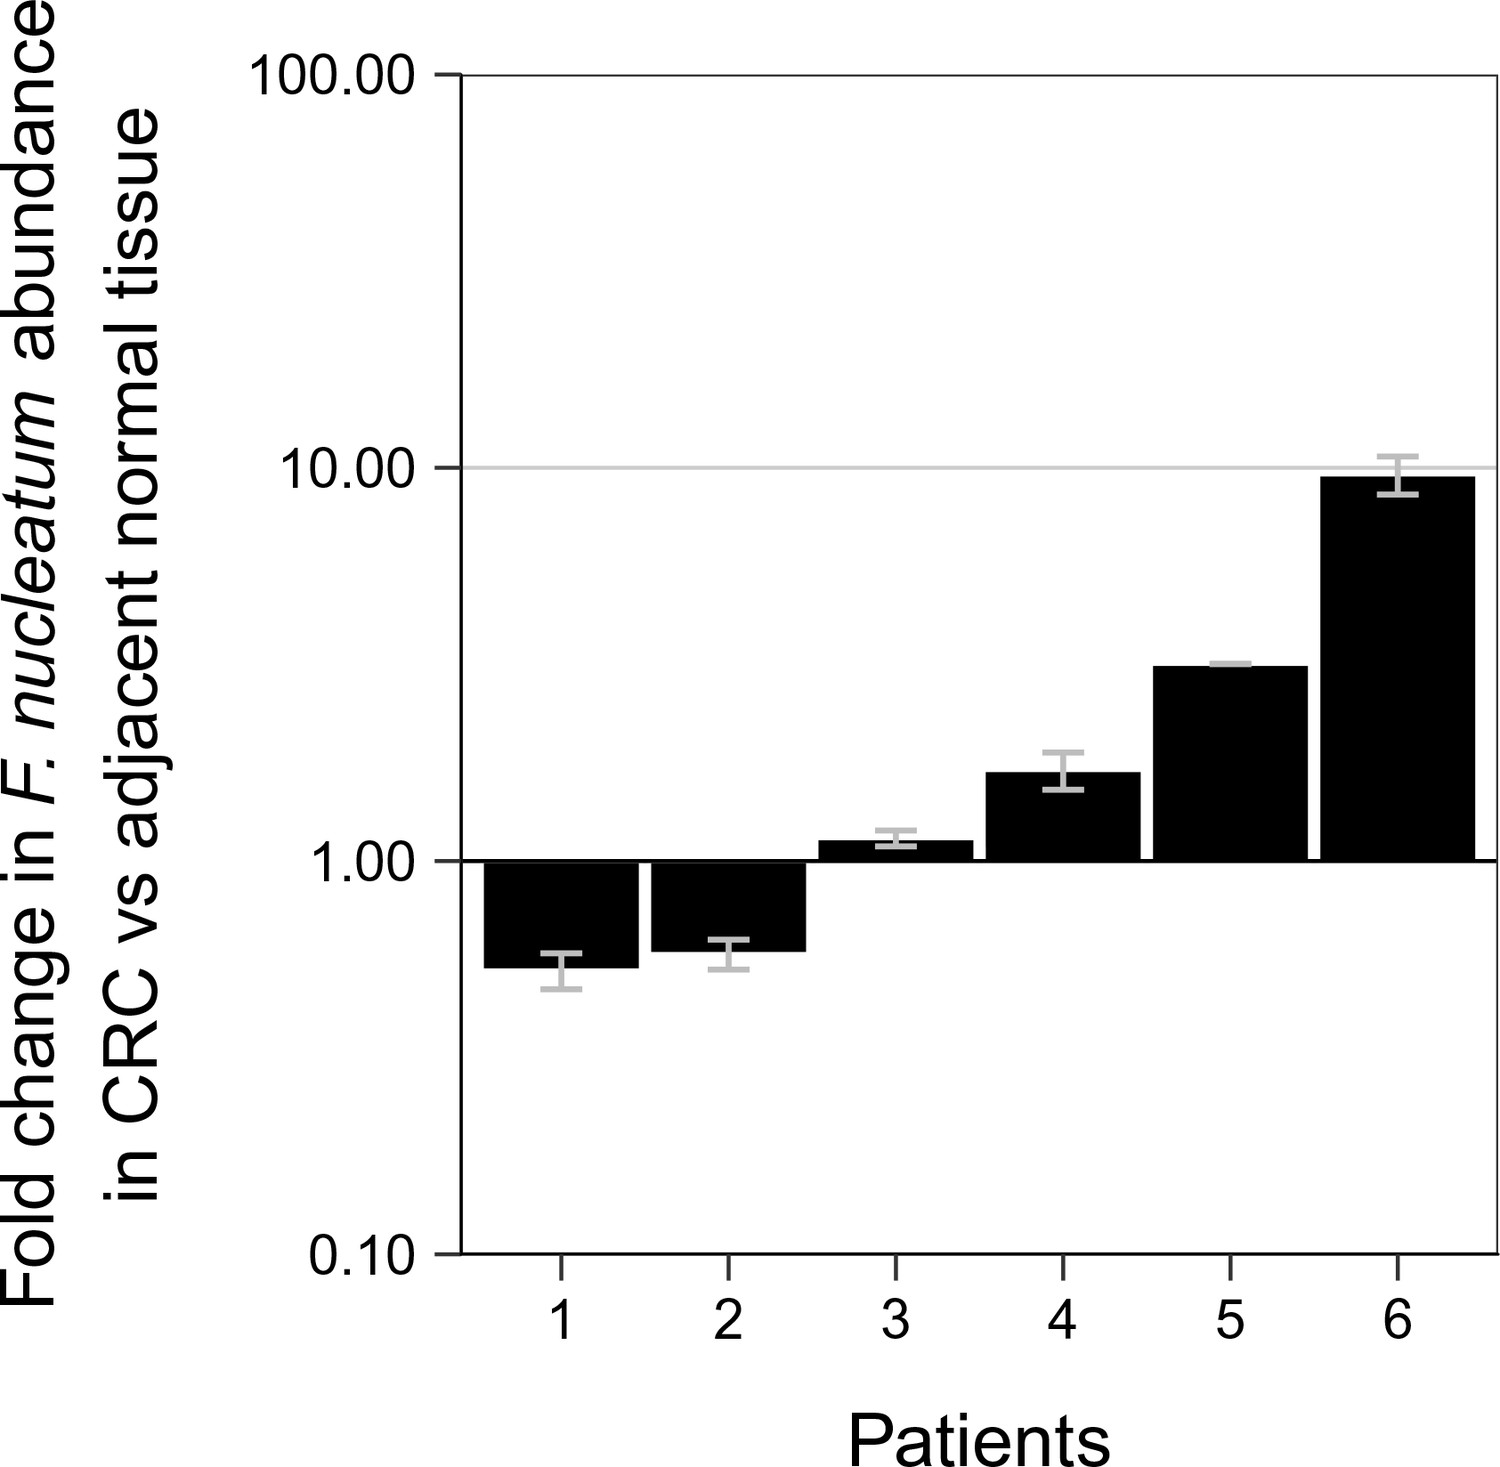
Relative abundance of F. nucleatum in colorectal carcinoma versus adjacent normal biopsies in samples with detectable F. nucleatum.
Only samples in which F. nucleatum was detected in both colorectal carcinoma (CRC) and adjacent normal tissue by quantitative PCR (qPCR) and confirmed by sequencing of the qPCR product are shown (n = 6). The mean relative abundance of F. nucleatum (normalized to PGT expression) in CRC tissue versus adjacent normal tissue of both independent runs is reported for each patient sample and error bars represent SEM. The y-axis represents mean fold gene expression change (2-ΔΔCt) while the x-axis represents patient samples. Exploratory analysis: two-tailed paired t test: t(5) = 1.067, p = 0.335, r = 0.43, 95% CI [−0.59, 0.92]. Additional details for this experiment can be found at https://osf.io/rb4yq/.
Figure 1—figure supplement 1

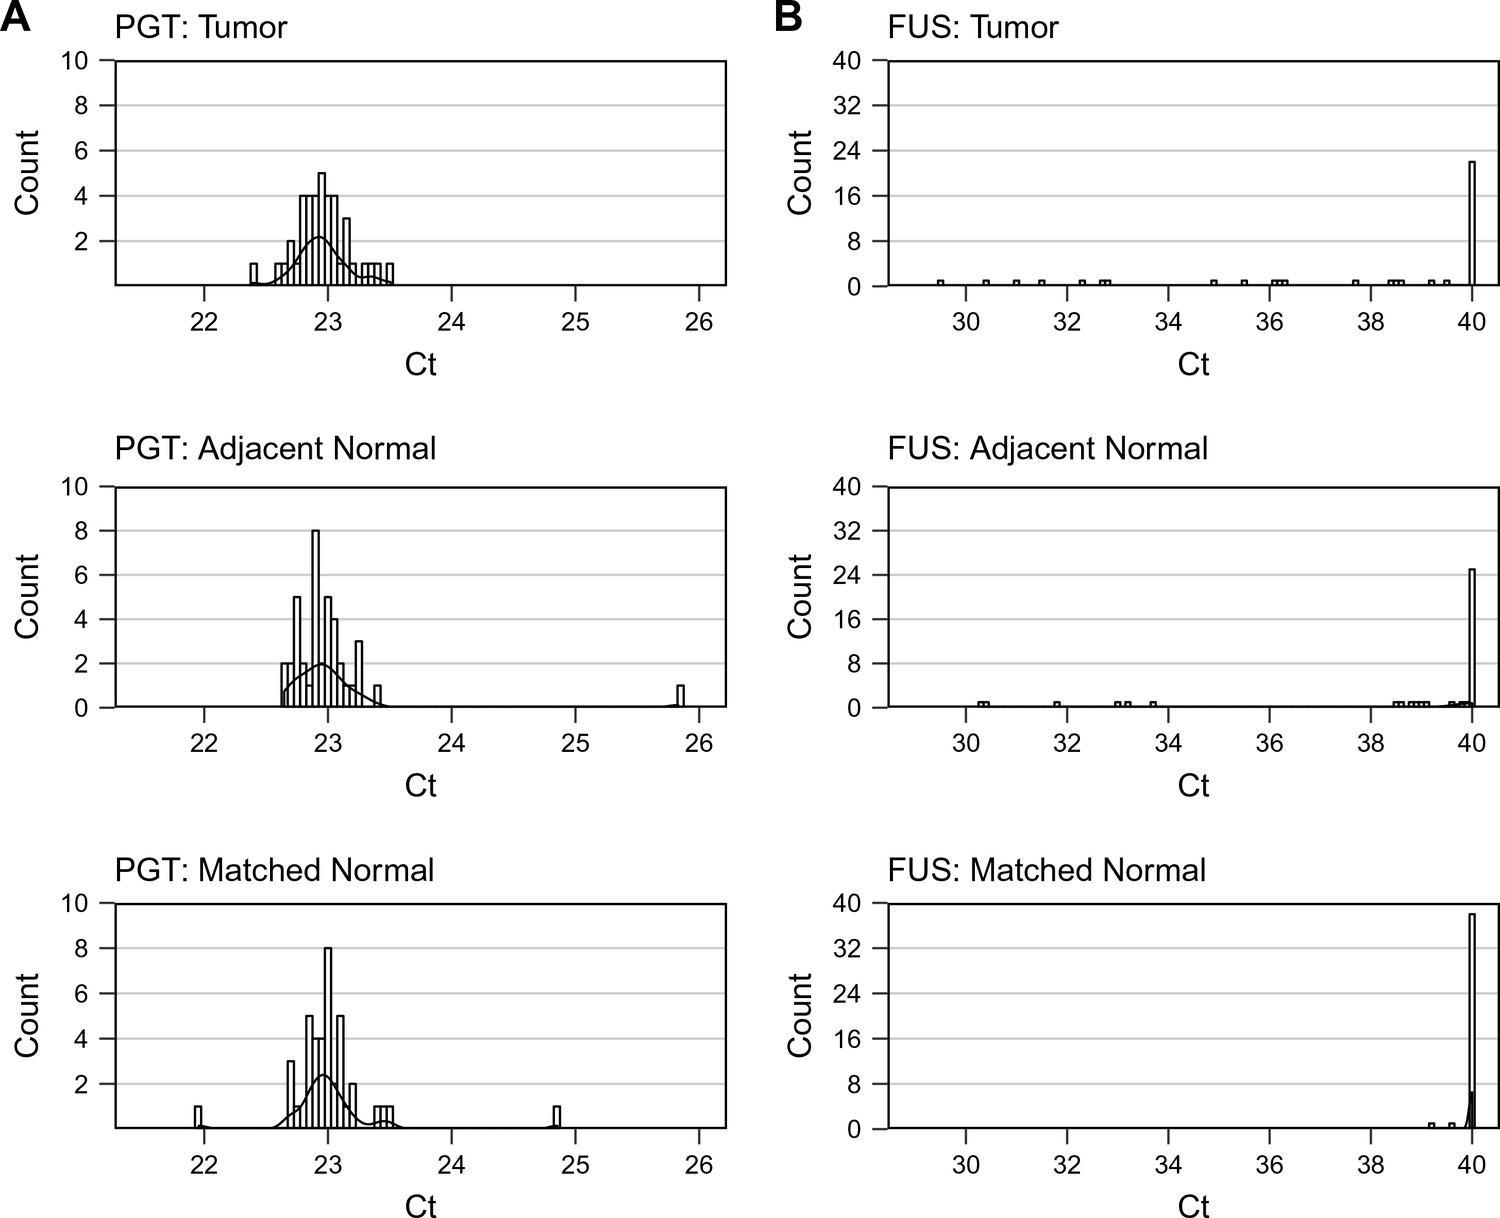
First independent qPCR run.
First of two independent qPCR runs performed in technical duplicate. (A) Distribution of raw Ct values for PGT in colorectal carcinoma (CRC) tumor, adjacent normal tissue, or matched normal samples. (B) Distribution of raw Ct values for F. nucleatum in each sample type (CRC tumor, adjacent normal tissue, or matched normal). The y-axis represents a binned count of each Ct score and the x-axis represents the value of Ct scores. Bin size = 0.1. Additional details can be found at https://osf.io/rb4yq/.
Figure 1—figure supplement 2
Second independent qPCR run.
Second of two independent qPCR runs performed in technical duplicate. (A) Distribution of raw Ct values for PGT in colorectal carcinoma (CRC) tumor, adjacent normal tissue, or matched normal samples. (B) Distribution of raw Ct values for F. nucleatum in each sample type (CRC tumor, adjacent normal tissue, or matched normal). The y-axis represents a binned count of each Ct score and the x-axis represents the value of Ct scores. Bin size = 0.1. Additional details can be found at https://osf.io/rb4yq/.
Figure 2 with 1 supplement
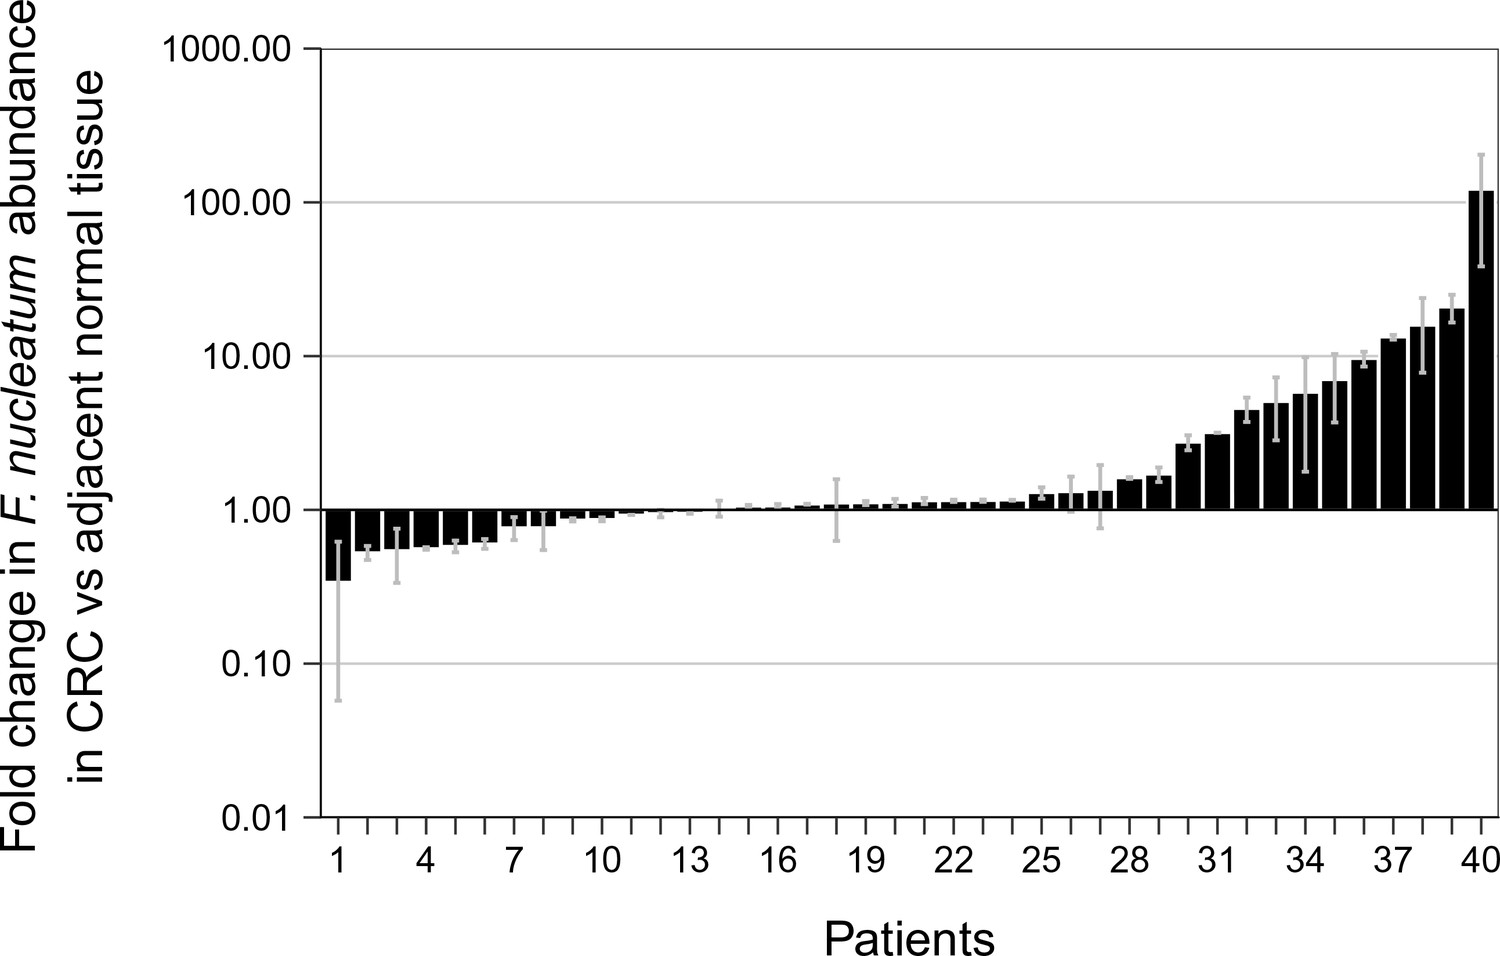
Relative abundance of F. nucleatum by qPCR in colorectal carcinoma versus adjacent normal biopsies.
Fold change values are shown for all paired specimens based on differences in Ct values, irrespective of whether the qPCR products were confirmed to be specific or non-specific upon sequencing. Tissue was collected from colorectal carcinoma (CRC) and adjacent normal tissue (n = 40). qPCR was performed independently two times and averaged. The mean relative abundance of F. nucleatum (normalized to PGT expression) in CRC tissue versus adjacent normal tissue of both independent runs is reported for each patient sample and error bars represent SEM. The y-axis represents mean fold gene expression change (2-ΔΔCt) while the x-axis represents patient samples. Two-tailed Wilcoxon signed-rank test: Z = 2.14, p = 0.032. Additional details for this experiment can be found at https://osf.io/rb4yq/.
Figure 2—figure supplement 1
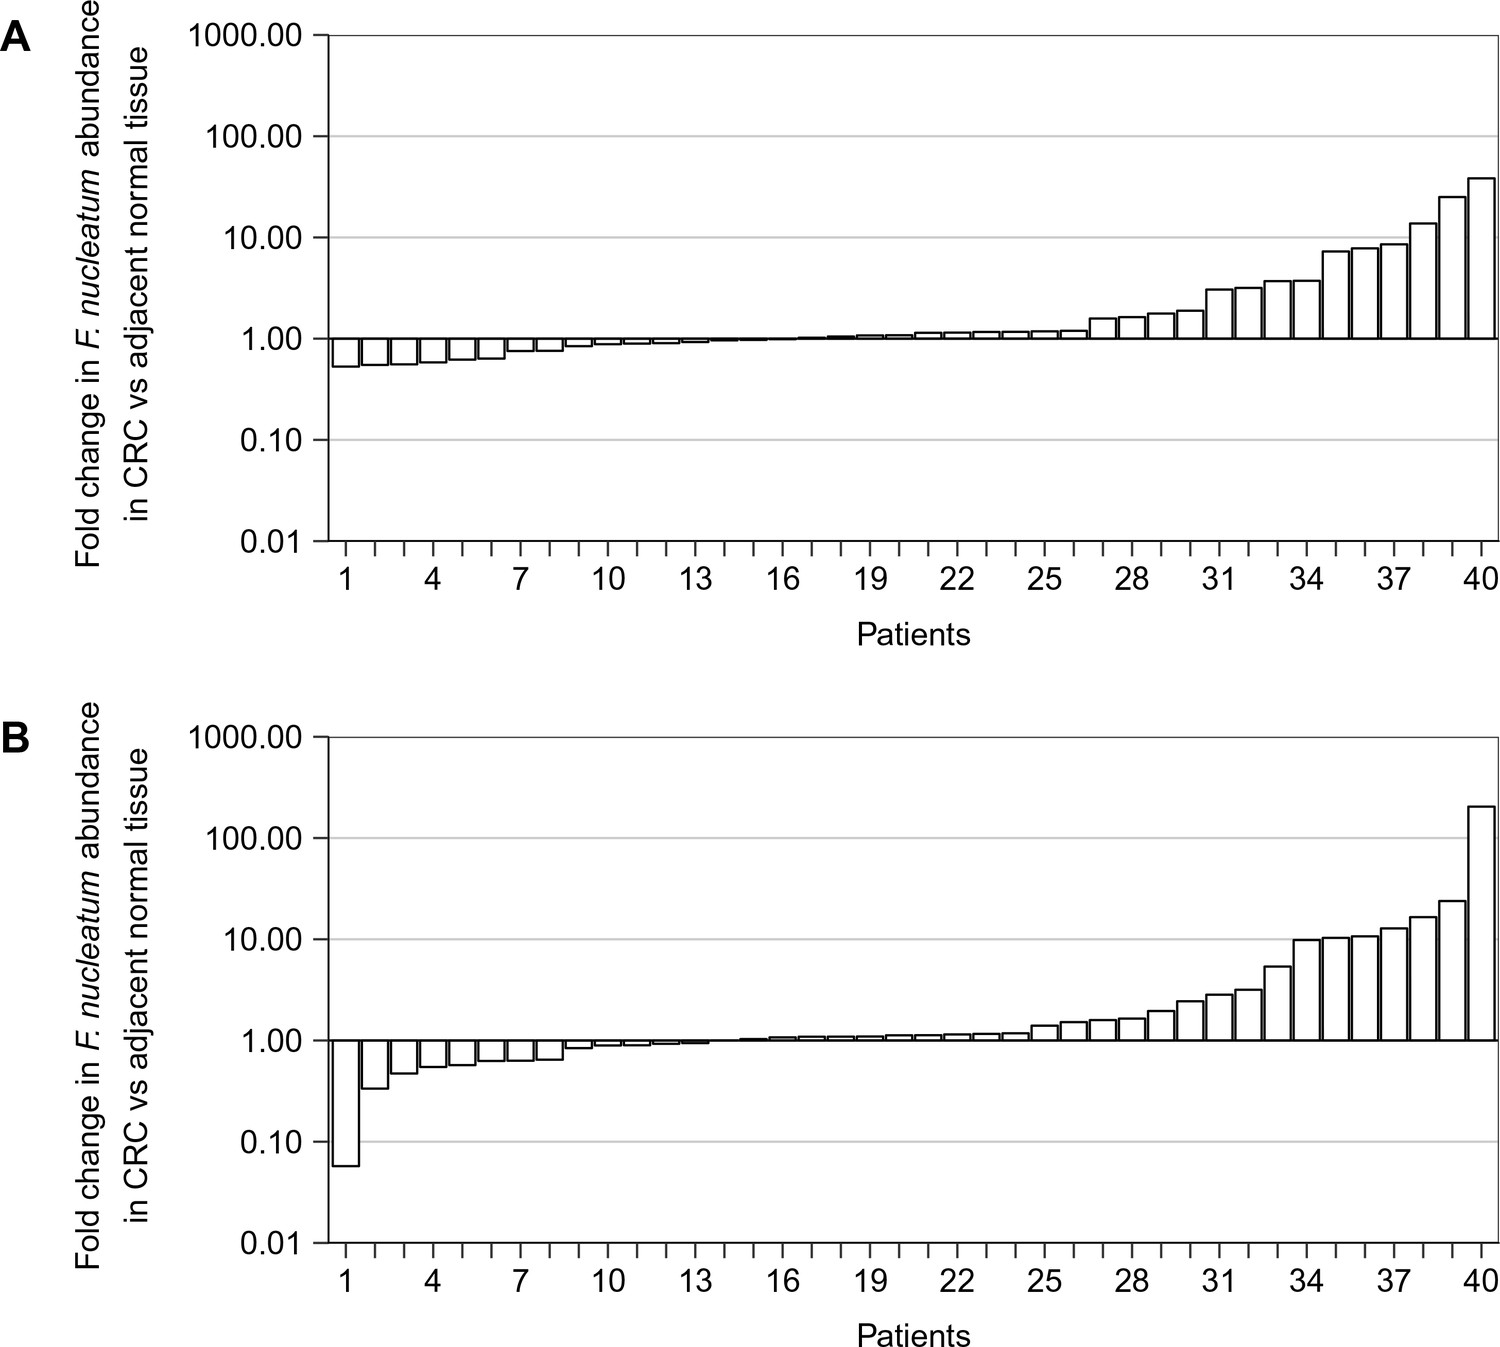
Independent qPCR runs.
Fold change values are shown for all paired specimens based on differences in Ct values, irrespective of whether the qPCR products were confirmed to be specific or non-specific upon sequencing. (A) First of two independent qPCR runs performed in technical duplicate. Mean relative abundance of F. nucleatum (normalized to PGT expression) in colorectal carcinoma (CRC) tissue versus adjacent normal tissue is reported for each patient sample. The y-axis represents mean fold gene expression change (2-ΔΔCt) and the x-axis represents patient samples. The median fold change across all samples was 1.11 (IQR = 0.89–2.18) and the mean fold change was 3.62 [SD = 7.21]. (B) Second of two independent qPCR runs performed in technical duplicate. Mean relative abundance of F. nucleatum (normalized to PGT expression) in CRC tissue versus adjacent normal tissue is reported for each patient sample. The y-axis represents mean fold gene expression change (2-ΔΔCt) and the x-axis represents patient samples. The median fold change across all samples was 1.13 (IQR = 0.90–2.54) and the mean fold change was 8.27 [SD = 32.2]. Additional details can be found at https://osf.io/rb4yq/.
Figure 3
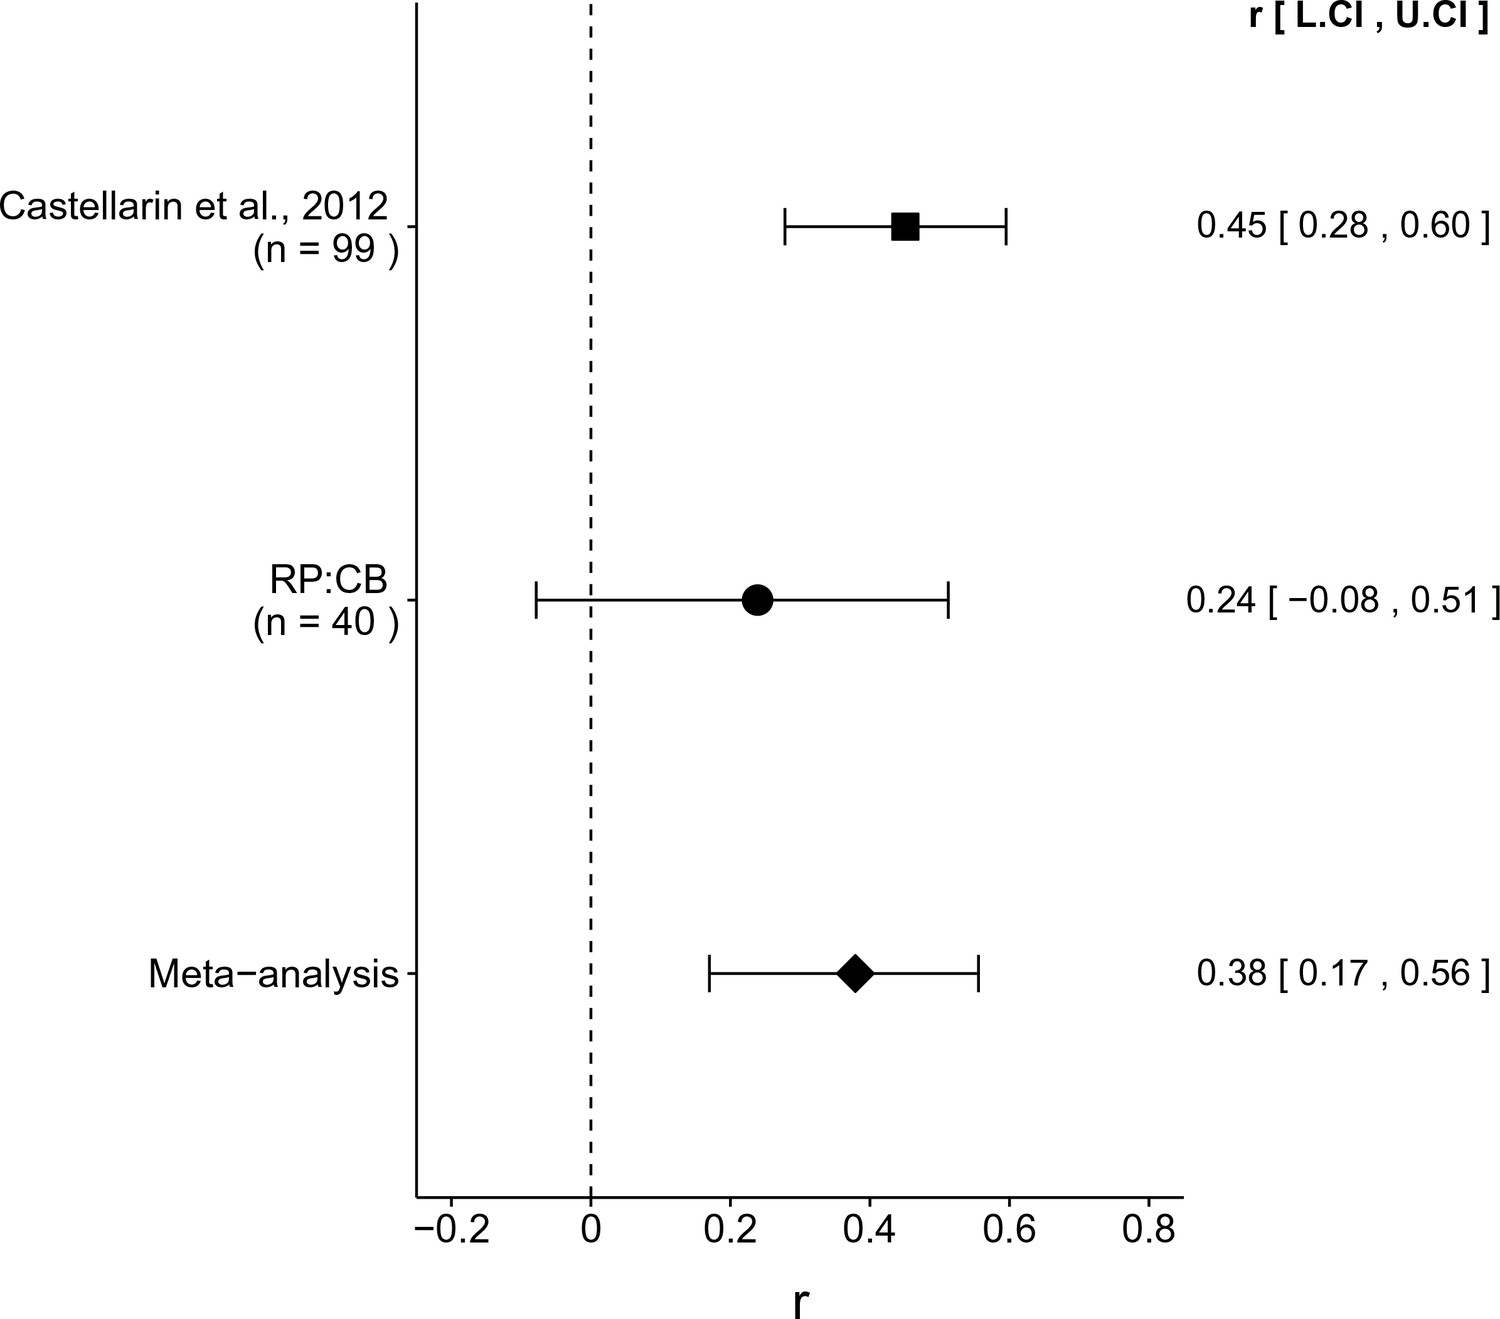
Meta-analyses of each effect.
Effect size (r) and 95% confidence interval are presented for Castellarin et al. (2012), this replication attempt (RP:CB), and a meta-analysis to combine the two effects. To directly compare and combine the results of both studies, the qPCR results for RP:CB were used irrespective of whether the amplicon was confirmed to be F. nucleatum by sequencing. The effect size r is a standardized measure of the correlation (strength and direction) of the association between tissue type and normalized F. nucleatum DNA levels, with a larger positive value indicating CRC tissue is correlated with a higher F. nucleatum expression level. Sample sizes used in Castellarin et al. (2012) and this replication attempt are reported under the study name. Random effects meta-analysis of the abundance of F. nucleatum in CRC tissue compared to adjacent normal tissue (meta-analysis p = 5.86 × 10⁻⁴). Additional details for this meta-analysis can be found at https://osf.io/kup8d/.
Additional files
-
Transparent reporting form
- https://doi.org/10.7554/eLife.25801.008
Download links
A two-part list of links to download the article, or parts of the article, in various formats.
Downloads (link to download the article as PDF)
Open citations (links to open the citations from this article in various online reference manager services)
Cite this article (links to download the citations from this article in formats compatible with various reference manager tools)
Replication Study: Fusobacterium nucleatum infection is prevalent in human colorectal carcinoma
eLife 7:e25801.
https://doi.org/10.7554/eLife.25801


